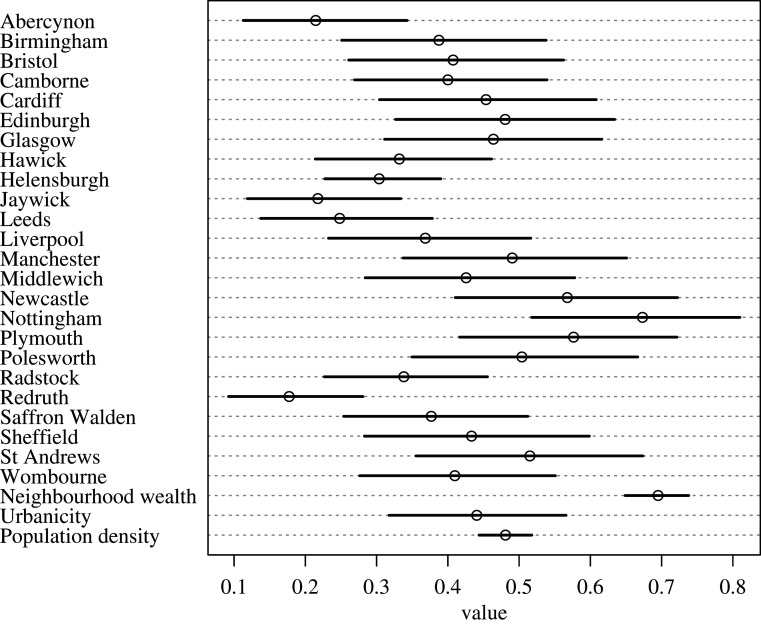
Figure 1.
Precis plot showing posterior mean binomial probabilities (with 89% percentile intervals) for (i) each location's intercept and (ii) the slopes associated with Urbanicity, Population Density, and Neighbourhood Wealth. Percentile intervals show the interval within which 89% of the probability mass for the predicted means is found. Following [48], we use 89% intervals to avoid readers drawing a spurious inference that these intervals correspond to significance tests. For each location, the intercept denotes the estimated probability of receiving help in that place (where 0 = low probability and 1 = high probability). For the parameters (Urbanicity, Population Density, and Neighbourhood Wealth), the binomial probability indicates the estimated effect of each treatment on the binomial probability of receiving help. Thus, the plot shows that in high-wealth neighbourhoods, there is a high probability of receiving help, but that there is little appreciable effect of urbanicity or population density on the probability of receiving help (binomial probability close to 0.5 for both parameters indicating that these parameters do not affect the likelihood of receiving help above chance levels).

