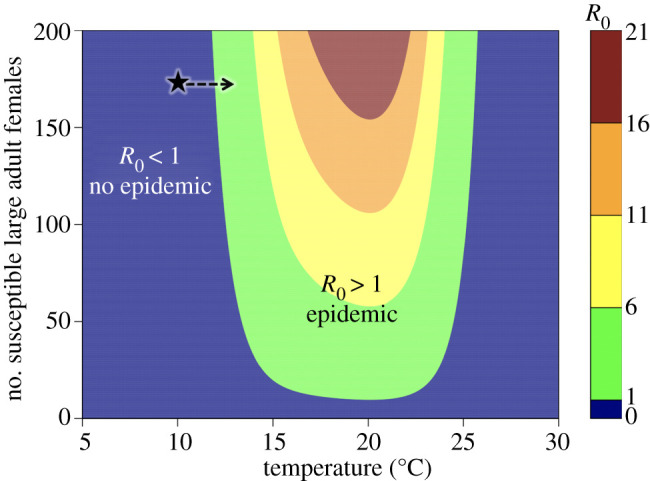
Figure 2.

The basic reproduction number (R0) as a function of temperature (x-axis) and susceptible large, adult female host density (y-axis) as predicted from equation (2.5). Blue represents conditions in which R0 < 1 and the disease cannot spread. The star denotes the approximate initial conditions of our experiment and the arrow denotes the trajectory of the warming populations. The arrow is moving horizontally across the plane, because we did not see any clear evidence of a temperature effect on Daphnia population abundances (electronic supplementary material, figure S1). The constant 10°C populations remained at the starred conditions for the duration of the experiment, while the warming populations moved to conditions where epidemics should occur. (Online version in colour.)
