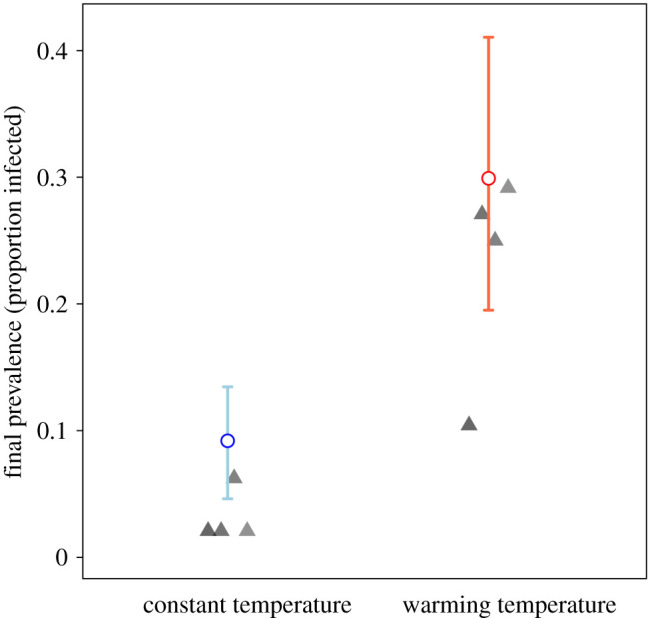
Figure 4.

Observed final prevalence based on 48 individuals (approx. 30% of population; solid triangles) compared to predicted final prevalence from the stochastic MTE model (hollow circles). Error bars represent 95% confidence intervals on the final prevalence values observed in 250 stochastic simulations. Experimental warming population prevalence (mean ± s.e. = 0.229 ± 0.043) had significantly higher disease prevalence (p < 0.0001; generalized linear model with logit link) at the conclusion of the experiment relative to the constant 10°C populations (mean ± s.e. = 0.031 ± 0.010). The prevalence and size of population are measured in terms of large, adult female Daphnia. (Online version in colour.)
