
Figure 3.
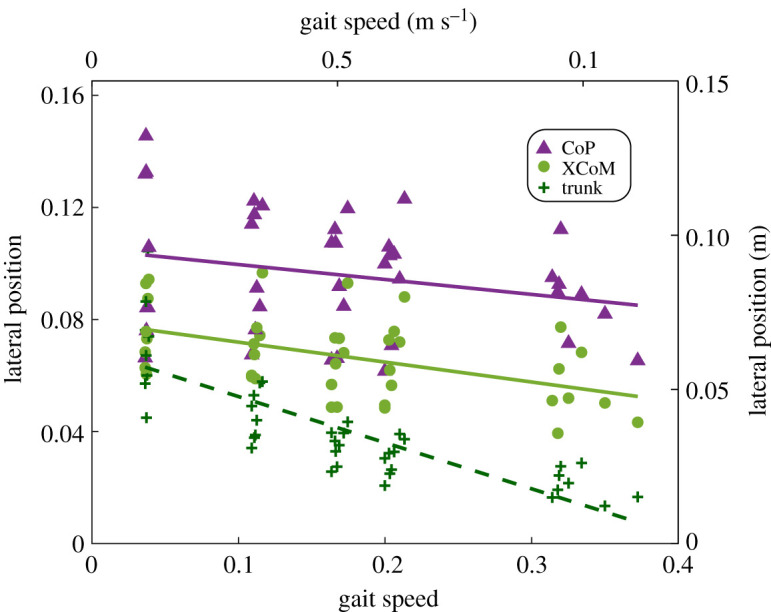
Linear regression of the lateral position of the CoP, XCoM and trunk CoM at the minimum MoS event. The average lateral position of the CoP, XCoM or trunk CoM at the minimum MoS event for each individual subject (dots) and their fits (solid and dashed lines) are shown (n = 8). Both the lateral CoP and XCoM position increased with slower gait speed at the minimum MoS (p < 0.05). The rate at which the XCoM lateral position increased was faster than that of the CoP. The lateral trunk CoM position, which affects the body CoM and XCoM, also increased as gait speed decreased (p < 0.05). The left and bottom axes display the normalized values, and the right and top axes display the values with SI units. (Online version in colour.)