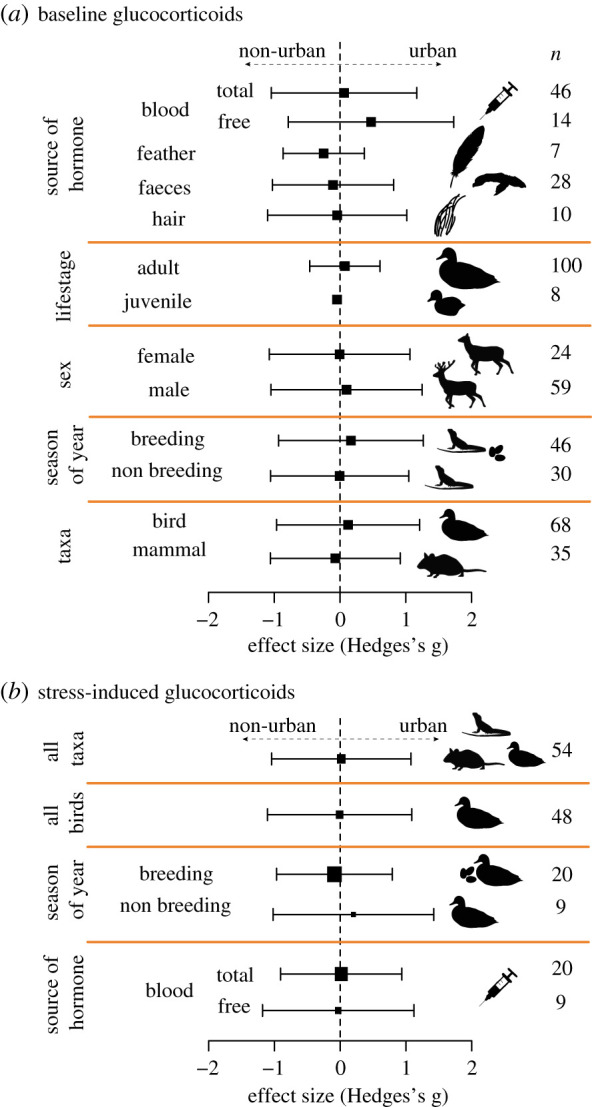
Figure 2.

(a) Response to being in an urban habitat of baseline glucocorticoid levels of all taxa (mean effect size and 95% confidence intervals), and partitioned on the basis of five moderators (source of hormone sample, life stage, sex, season and taxa). (b) Response to being in an urban habitat of stress-induced glucocorticoid levels of all taxa, all birds and male birds partitioned by season and source of hormone. Positive effect sizes indicate higher glucocorticoid levels in urban habitats. Numbers represent the sample size for effect size. (Online version in colour.)
