
Figure 8.
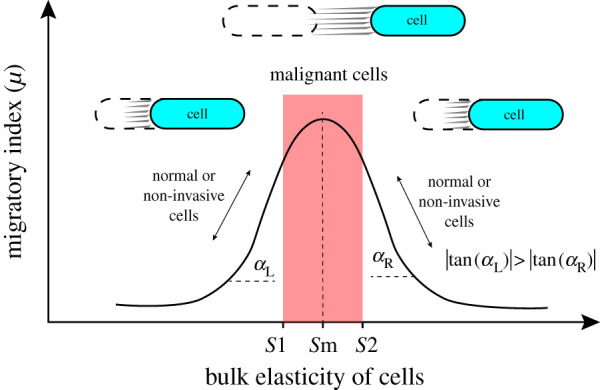
Typical migratory index responses of cells and their changes by altering cell stiffness. At the critical value/range (red region), the migratory index is maximum, and cells could move fast; outside of the critical range, cell movement is reduced either by reducing cells stiffness or enhancing the stiffness of the cell.