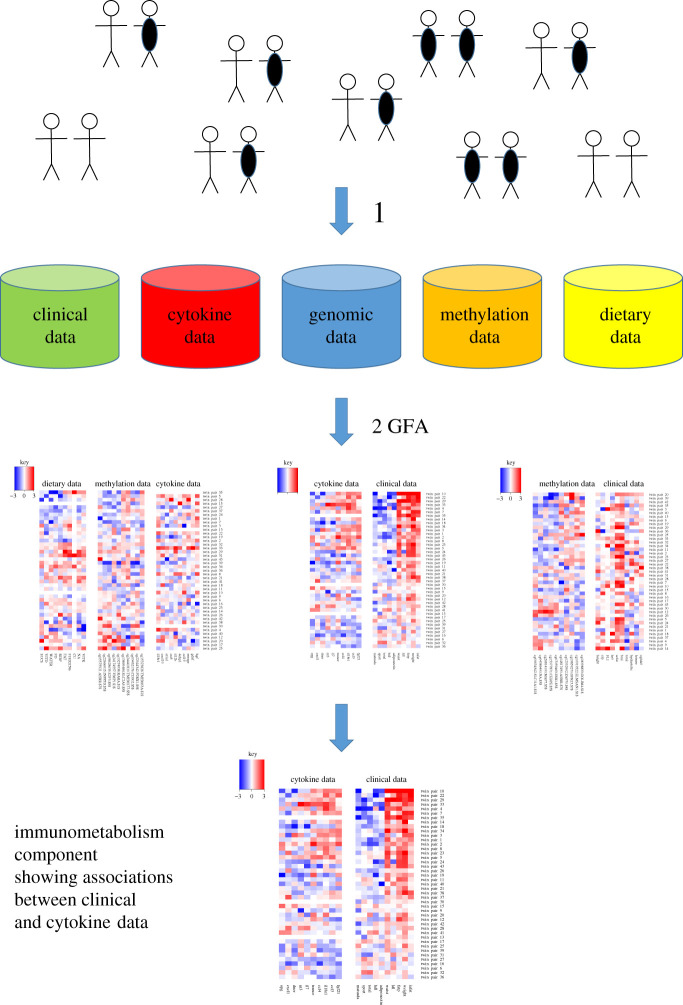
Figure 1.
Pipeline for the GFA analysis on MZ twin pairs. (1) Clinical, cytokine, genomic, methylation and dietary data were collected from 43 young adult monozygotic twin pairs, where 25 of the twin pairs were substantially weight discordant (delta BMI > 3 kg m–2). For each twin pair and each variable, the value for the leaner twin was subtracted from the value for the heavier twin. This resulted in five large data matrices comprising 42, 71, 1587, 1605 and 63 variables, respectively. (2) All five large data matrices were input into the group factor analysis (GFA) computational tool, giving rise to 38 so-called component diagrams (three of which are shown in this figure). Each component diagram has up to five small heatmaps picturing the associations discovered within or between the five datasets. The magnified component is the immunometabolism component, also in figure 3.

