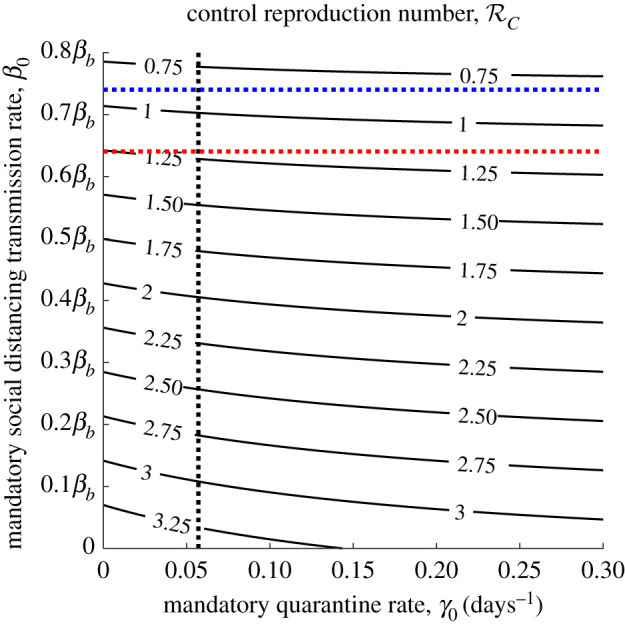
Figure 2.

Contour plot of the control reproduction number (3.1) versus mandatory quarantine and social distancing transmission rates. Intersection between dotted black and red (resp. blue) lines indicates the value after the first (resp. second) step reduction. Other parameters values are given in table 1.
