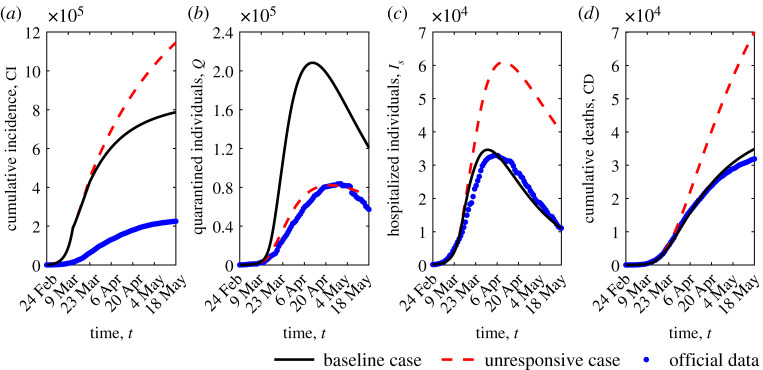
Figure 3.
Epidemic evolution predicted by model (2.1)–(2.2): cumulative incidence (a), quarantined individuals (b), hospitalized individuals (c) and cumulative deaths (d). The predicted evolution (black solid lines) is compared with the unresponsive case α = D = 0 (red dashed lines) and with official data (blue dots). Parameter values are given in tables 1 and 2.

