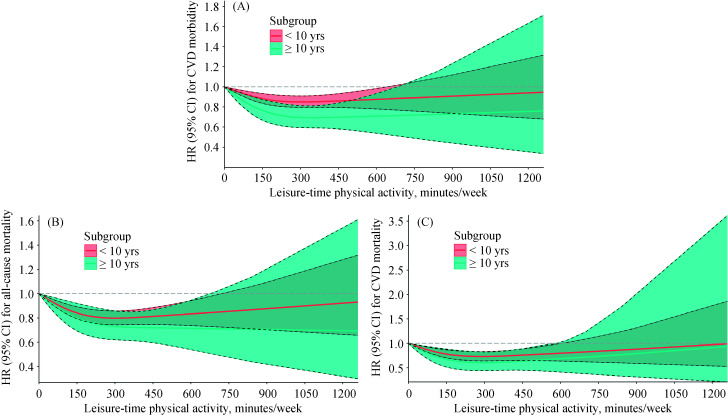
Figure 3.
HRs for all-cause mortality and CVD according to LTPA in subgroups.
(A): A association between LTPA (as a continuous variable, min/week) and risk of CVD morbidity in subgroups; (B): a association between LTPA (as a continuous variable, min/week) and risk of all-cause mortality in subgroups; and (C): a association between LTPA (as a continuous variable, min/week) and risk of CVD mortality in subgroups. CI: confidence interval; CVD: cardiovascular disease; HR: hazards ratio; LTPA: leisure-time physical activity.

