
Figure 2.
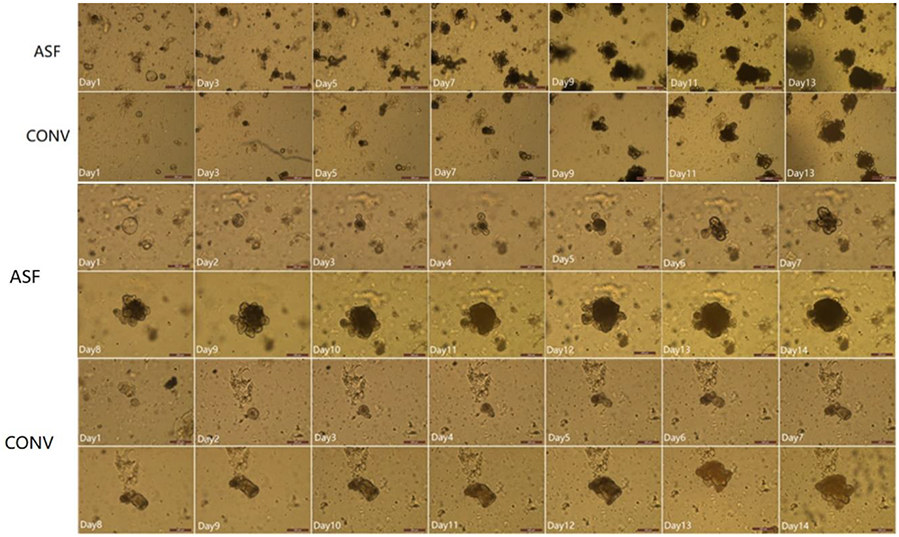
Morphological features of miniguts derived from ASF (top row) and CONV (2nd row) mice. Numbers in the images represent the number of days since the intestinal stem cell cultures were initiated. The scale bars in 1st and 2nd rows represent 500 μm. Time course for the change in size of a single miniguts derived from ASF (the 3rd and 4th rows) or CONV (the 5th and 6th rows) mice. Numbers in the images represent the number of days since the intestinal stem cell cultures were initiated. The scale bars in 3rd, 4th, 5th and 6th rows represent 200 μm.