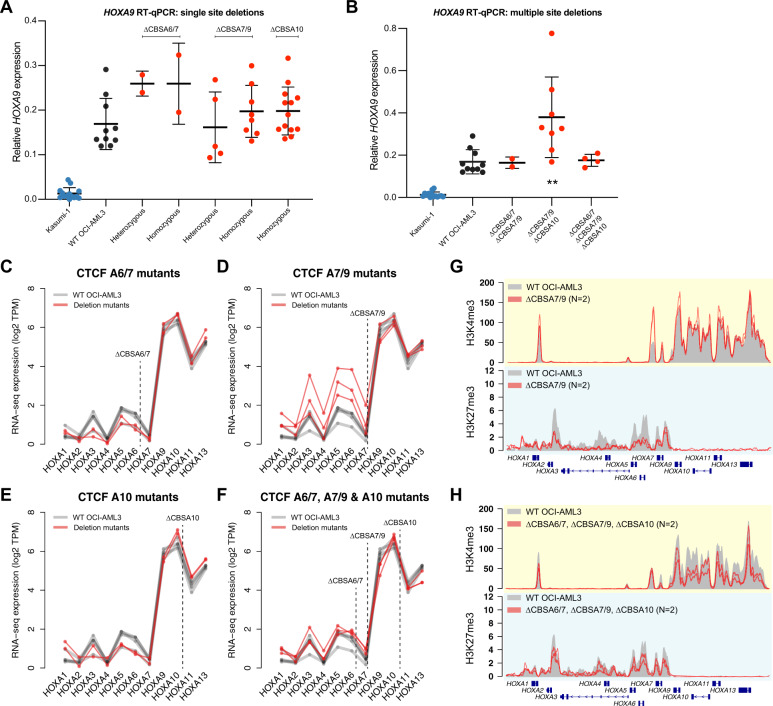
Fig. 4. CTCF binding is not required to maintain gene expression or chromatin boundaries in the HOXA gene cluster.
a RT-qPCR for HOXA9 in single mutants with heterozygous or homozygous deletions at CBSA6/7, CBSA7/9, or CBSA10. HOXA9 expression from the Kasumi-1 cell line is shown in blue as a no-HOXA9 expressing control. No statistically significant differences were identified between wild-type OCI-AML3 and homozygous mutants (Bonferroni-corrected P > 0.05 using a two-sided unpaired T-test for all comparisons). b RT-qPCR for HOXA9 in double and triple mutants at the CTCF binding sites indicated. Kasumi-1 cells are included in blue as in a. ** denotes a Bonferroni-corrected P < 0.01 between wild-type OCI-AML3 and CBSA7/9-CBSA10 double mutant clones using a two-sided unpaired T-test. c–f RNA-seq expression of all HOXA genes in single mutants (c–e) and triple mutants (d). Expression level is shown in log2 transcripts per million (TPM), with lines connecting expression values derived from the same mutant clones and/or the same RNA-seq experiment (for wild-type OCI-AML3 cells). g ChIP-seq for H3K4me3 and H3K27me3 in deletion mutants lacking CTCF at site CBSA7/9 (in red; N = 2). Mean ChIP-seq signal from wild-type OCI-AML3 cells (N = 2) is shown in gray. h Mean ChIP-seq for H3K4me3 and H3K27me3 in triple mutants (N = 2), with ChIP-seq from wild-type cells shown in gray, as in g.

