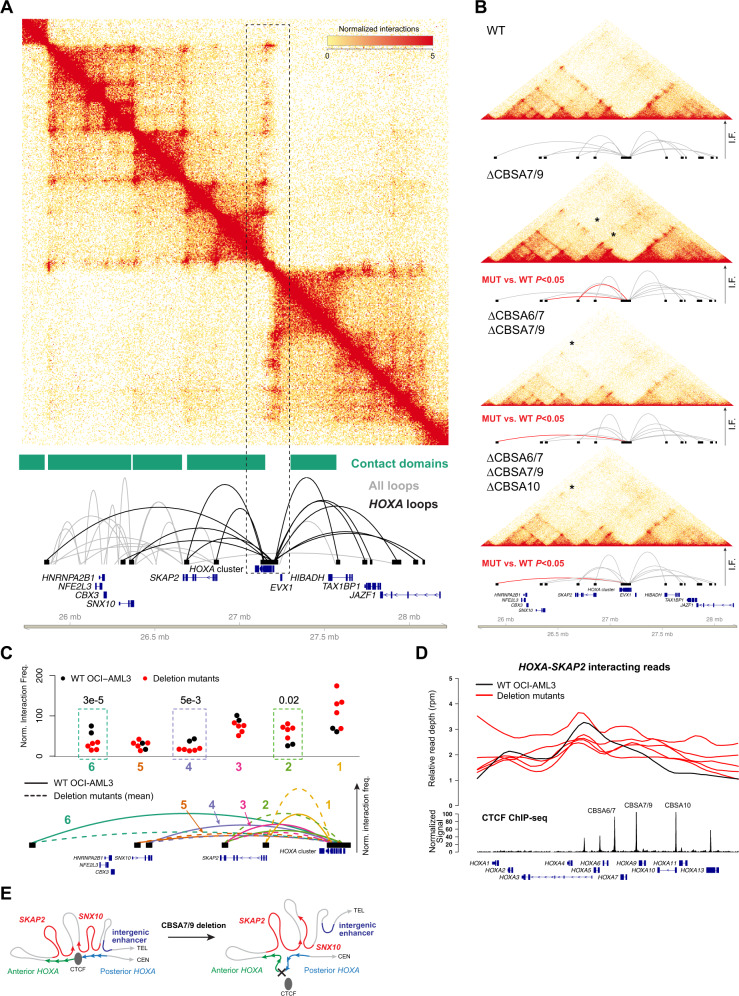
Fig. 5. CTCF-mediated chromatin architecture at the HOXA locus in NPM1-mutant OCI-AML3 cells.
a Contact matrix, contact domains, and chromatin loops for a 2.5 Mbp region of chromosome 7p that contains the HOXA gene cluster from in situ Hi-C using wild-type OCI-AML3 cells. Top panel shows the KR-normalized contact matrix at 5 kb resolution. Tracks below the matrix show the contact domains and statistically supported chromatin loops identified using established methods [26]. Loops shown in black are anchored within the HOXA gene cluster. b Contacts and HOXA region loops from in situ Hi-C from wild-type OCI-AML3 cells and homozygous (biallelic) single mutants at CBSA7/9, double mutants at CBSA6/7 and CBSA7/9, and triple mutants at CBSA6/7, CBSA7/9, and CBSA10. Loops in red indicate statistically significant differences in pairwise comparisons between each mutant and wild-type cells with a chromosome-wide FDR < 0.05. c Normalized interaction frequencies for all datasets for six telomeric loops. Top panel shows normalized interaction frequencies for individual Hi-C libraries from wild-type OCI-AML3 cells (N = 2), single mutants at CBSA7/9, CBSA6/7-CBSA7/9, and CBSA7/9-CBSA10 double mutants, and two CBSA6/7-CBSA7/9-CBSA10 triple mutant lines (N = 5 total mutant lines). Dashed boxes highlight loops that were statistically different in comparisons of all mutant libraries vs. two wild-type OCI-AML3 libraries (chromosome-wide FDR < 0.5). Mean interaction frequencies for chromatin loops from wild-type and mutant lines are shown graphically in the lower panel in solid and dashed lines, respectively, and are numbered so they correspond with the normalized frequencies shown in the top panel. d Relative read depth (reads per million) across the HOXA locus for reads that interact between HOXA and SKAP2. Depth for wild-type OCI-AML3 cells is shown in black and deletion mutants are shown in red. CTCF ChIP-seq signal from wild-type OCI-AML3 cells and HOXA genes are shown in the bottom tracks. CTCF site deletions result in enhanced interactions between the posterior HOXA cluster (genes HOXA9-HOXA13) with the SKAP2 gene. e Graphical representation of HOXA chromatin loops in wild-type OCI-AML3 cells (left) and deletion mutants lacking HOXA CTCF binding sites (right).

