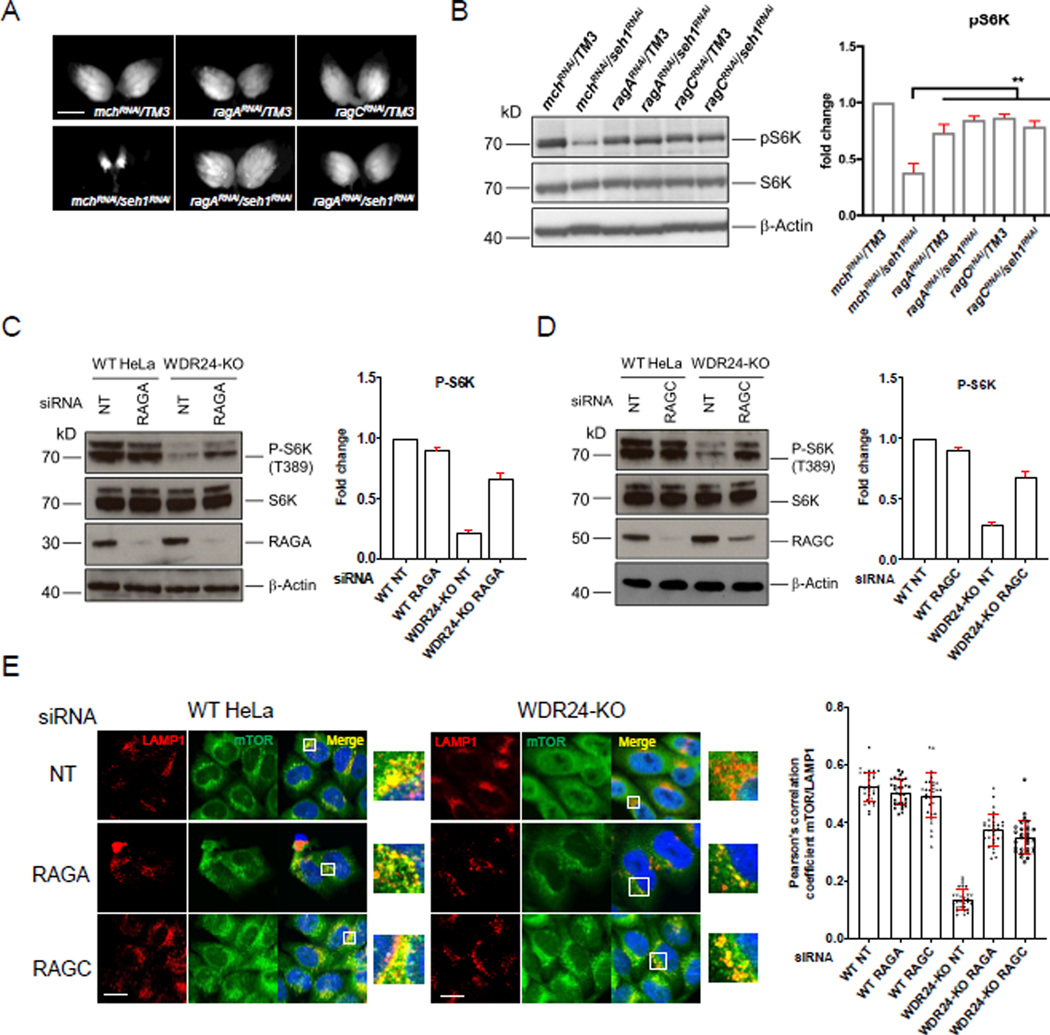
Figure 1. The Rag GTPase inhibits TORC1 in GATOR2 mutant Drosophila and HeLa cells.
(A) Co-depletions of ragA or ragC rescue the small ovary phenotype of seh1RNAi females. ragARNAi, ragCRNAi and seh1RNAi TRiP constructs were driven by the germline specific driver nanos-GAL4VP16. mchRNAi: mCherry-RNAi. Scale bar: 1 mm.
(B) Knockdowns of ragA or ragC increase pS6K levels in seh1RNAi ovaries, error bars in pS6K quantification graph represent standard deviation. Unpaired Student’s t-test was used to calculate p values. mchRNAi: mCherry-RNAi. **: p < 0.01.
(C) Immunoblot for P-S6K (T389) in WT and WDR24-KO HeLa cells treated with control (NT) or RAGA siRNAs. Error bars represent standard deviation.
(D) Immunoblot for P-S6K (T389) in WT and WDR24-KO HeLa cells treated with control (NT) or RAGC siRNAs.
(E) mTOR and LAMP1 immunostaining and colocalization analysis in WT and WDR24-KO HeLa cells treated with control (NT), RAGA or RAGC siRNA. Scale bar: 10 μm. The colocalization coefficient was calculated based on 30 cells per condition. Error bars represent standard deviation. See also Figure S1.

