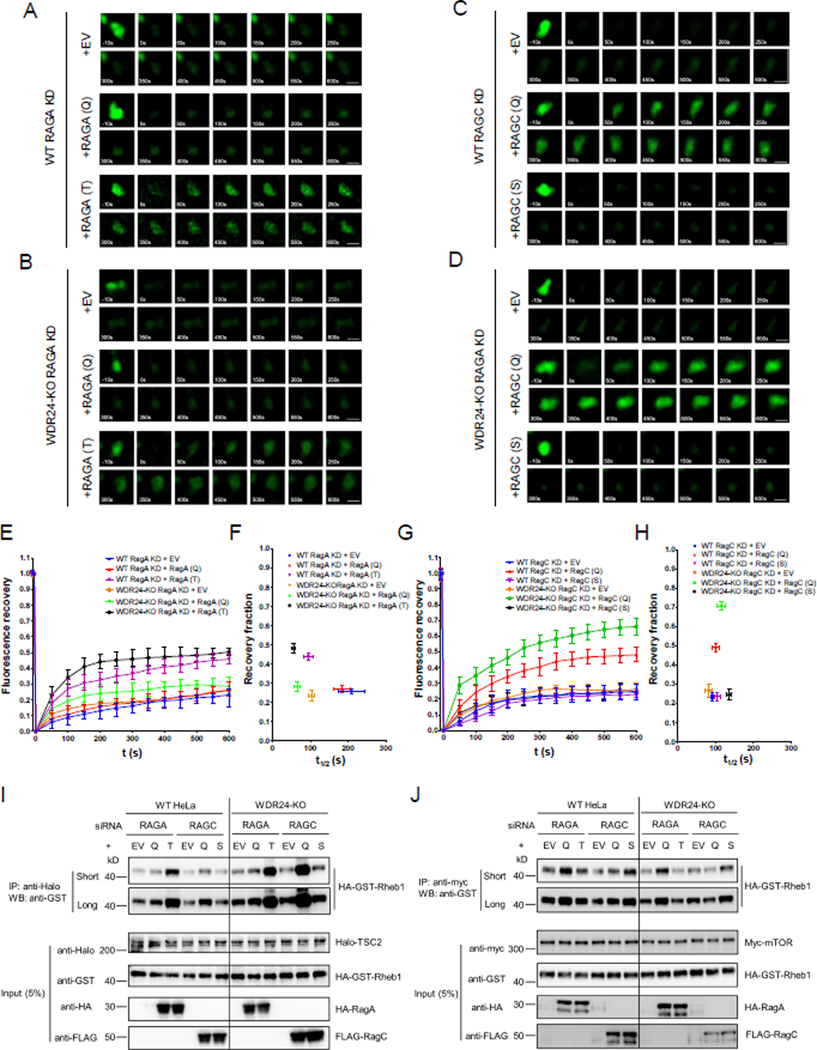
Figure 4. The guanine nucleotide binding status of RAGA and RAGC control the recruitment of TSC to lysosomes.
(A) Time point images from Halo-TSC2 FRAP experiment in WT HeLa cells transfected with GDP or GTP bound RAGA. Scale bar: 0.5 μm.
(B) Time point images from the Halo-TSC2 FRAP experiment in WDR24-KO HeLa cells transfected with GDP or GTP bound RAGA.
(C) Time point images from the Halo-TSC2 FRAP experiment in WT HeLa cells transfected with GDP or GTP bound RAGC.
(D) Time point pictures from the Halo-TSC2 FRAP experiment in WDR24-KO HeLa cells transfected with GDP or GTP bound RAGC.
(E) Fluorescence recovery versus time curves in A and B. A total of 30 lysosomes from 30 different cells were used to plot the curves for each treatment. Error bars represent standard error.
(F) Plot showing the relation between the recovery fraction versus half time (t1/2) from the curves in E. Error bars represent standard error.
(G) Fluorescence recovery versus time curves in C and D. A total of 30 lysosomes from different cells were used in plotting the curves for each treatment. Error bars represent standard error.
(H) Plot showing the relation between the recovery fraction versus half time (t1/2) from the curves in G. Error bars represent standard error.
(I) Co-IP experiments showing that GDP-bound RAGA and GTP-bound RAGC increased the interaction between Halo-TSC2 and HA-GST-Rheb. Cell lysates were immunoprecipitated by an anti-Halo antibody and immunoblotted by an anti-GST antibody. (Short: blot was exposed for 10 s; Long: 1 min)
(J) Co-IP experiment showing GTP-bound RAGA and GDP-bound RAGC increased the interaction between Myc-mTOR and HA-GST-Rheb. Cell lysates were immunoprecipitated by an anti-Myc antibody and immunoblotted by an anti-GST antibody.

