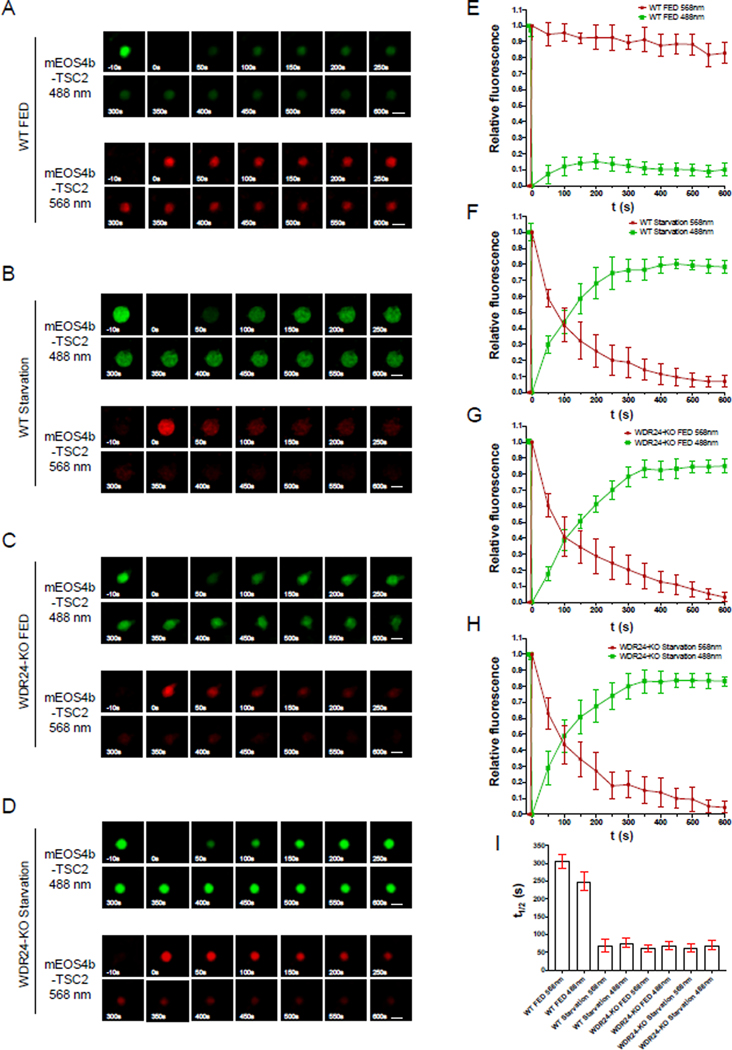
Figure 5. TSC2 rapidly cycles on and off lysosomes in GATOR2 mutant and starved cells.
(A) Time point images from photoconversion experiment in WT Hela cells transfected with mEOS4b-TSC2 in nutrient replete conditions. The 0s image represents photoconversion. Scale bar: 0.5 μm.
(B) Time point images from photoconversion experiment in WT Hela cells transfected with mEOS4b-TSC2 under starvation condition.
(C) Time point images from photoconversion experiment in WDR24-KO Hela cells transfected with mEOS4b-TSC2 subjected to nutrient replete conditions.
(D) Time point images from photoconversion experiment in WDR24-KO Hela cells transfected with mEOS4b-TSC2 under starvation condition.
(E-H) Change in relative fluorescence of unconverted mEOS4b-TSC2 at 488 nm (green curve) and photo converted protein in 568 nm (red curve) over 600s period corresponding to the results shown in A-D. A total of 30 lysosomes in each condition were used. Error bars represent standard error.
(I) Comparisons of the half-time (t1/2) for mEOS4b-TSC2 at 488 nm and 568 nm in corresponding to panels A-D. Scale bars represent standard error.

