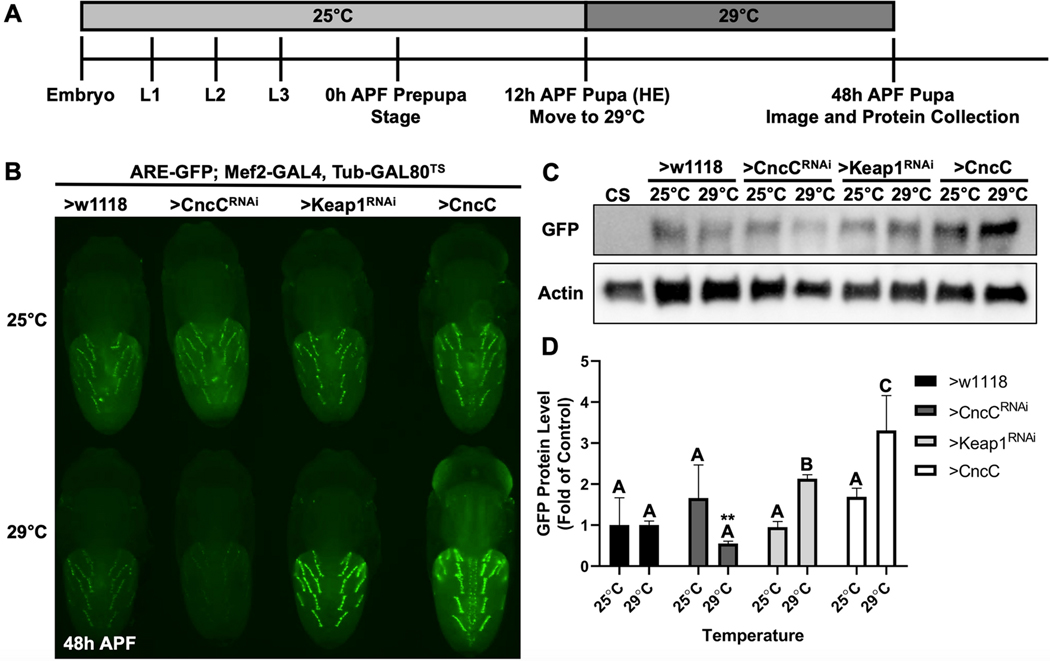
Fig. 2. An in vivo ARE activity reporter is responsive to CncC and Keap1 expression.
a A schematic for inducing gene expression using the ARE-GFP; Mef2-GAL4, Tub-GAL80TS strain. b Representative images of non-induced and induced 48h APF pupae. Top row is of age-matched, temperature control pupa of each genotype. The bottom row is of pupa after a 36-hour 29°C induction starting at head eversion (HE). c Representative Western blot of GFP and actin protein from whole pupa protein extracts from each genotype and temperature. The Canton S (CS) wild-type strain acts as a negative control for GFP protein. d Quantification of GFP band intensities. CncC and Keap1 experimental groups are normalized to respective w1118 temperature controls (n = 3, mean ± s.d.m., One-way ANOVA with Tukey’s HSD, p<0.05, significant differences indicated by different letter labels). Comparison of 29°C w1118 and CncCRNAi band intensities by Student’s t test is statistically significant (**p<0.01).

