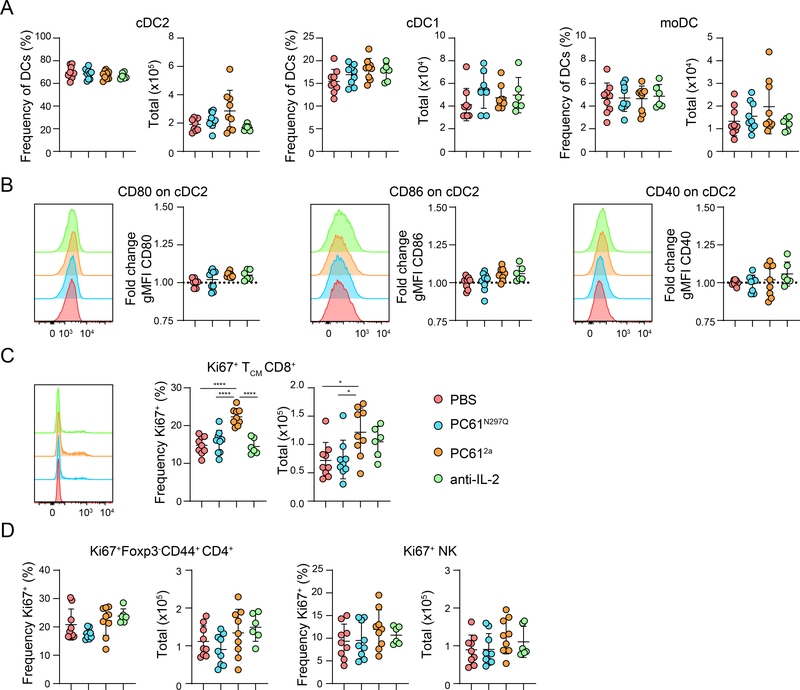
Figure 3.
Impacts of targeting the IL-2/CD25 axis on DCs and Teff cells
(A-B) WT B6 mice were treated IP with PBS, PC61N297Q, PC612a, or anti-IL-2 (JES6), and sacrificed after seven days for analysis. (A) Graphical analysis of frequency and total number of splenic MHCII+CD11c+33D1+CD11b+ cDC2, MHCII+CD11c+33D1-CD11b-CD8+ cDC1, and MHCII+CD11c+33D1-CD11b+CD8- moDC. (B) Representative flow cytometry histograms of CD80, CD86 and CD40 expression by gated splenic cDC2. Corresponding graphical analysis of fold change gMFI over PBS controls of CD80, CD86 and CD40 in splenic cDC2s in each treatment group. (C) Representative flow cytometry histograms of Ki67 expression by gated CD44+CD62L+ CD8+ TCM cells. Graphical analysis of frequency and total number of splenic Ki67+ CD8+ TCM cells in each treatment group. (D) Graphical analysis of frequency and total number of splenic Ki67+Foxp3-CD44+CD4+ Teff cells, and Ki67+ NK cells in each treatment group. Data is combined from three independent experiments, 6–9 mice per group total. Significance determined by one-way ANOVA with Tukey post-test for multiple comparisons. *p<0.05, **p<0.01, ***p<0.001, ****p<0.0001.

