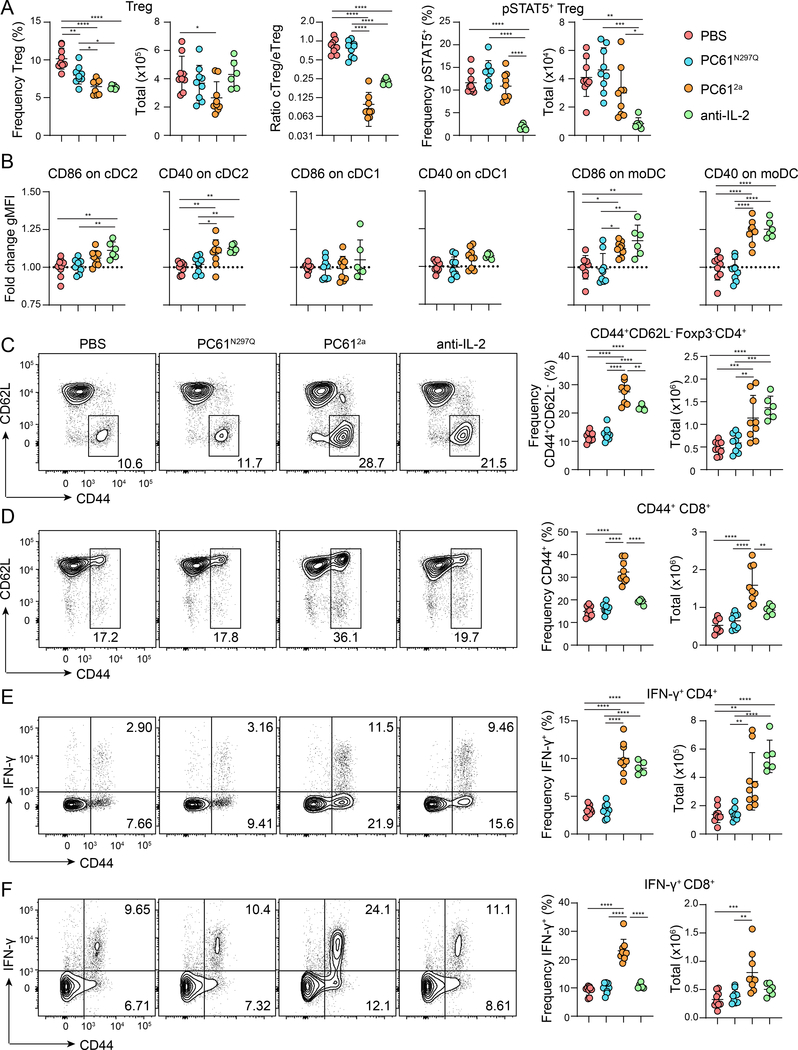
Figure 5.
Impact of long-term blockade of IL-2 or CD25 on Treg cells and immune homeostasis
WT B6 mice were treated with PBS, PC61N297Q, or PC612a every 7 days or anti-IL-2 every 5 days, and sacrificed after 28 days for analysis. (A) Left, graphical analyses of frequency and total number of splenic Treg cells in each treatment group. Middle, graphical analyses of the ratio of CD62L+ cTreg to CD44+ eTreg in the spleens of each treatment group. Right, graphical analysis of frequency and total number of pSTAT5+ splenic Treg cells in each treatment group. (B) Graphical analysis of fold change gMFI over PBS controls of CD86 and CD40 in splenic cDC2s, cDC1s, and moDCs in each treatment group. Representative analysis of CD44 and CD62L expression by gated splenic CD4+Foxp3- T cells (C) and CD8+ T cells (D) in each treatment group. Right, corresponding graphical analyses of frequency and total number of gated CD4+Foxp3-CD44+CD62L- (C) and CD8+CD44+ (D) T cells. (D) Representative analysis of CD44 and IFN-γ expression in gated CD4+ (E) and CD8+ (F) T cells from each treatment group after stimulation in vitro for 4 hours with PMA, ionomycin and monensin. Right, graphical analysis of frequency and total number of IFN-γ producing CD4+ and CD8+ T cells in each treatment group. Data is combined from three independent experiments, 6–9 mice per group total. Significance determined by one-way ANOVA with Tukey post-test for multiple comparisons. *p<0.05, **p<0.01, ***p<0.001, ****p<0.0001.

