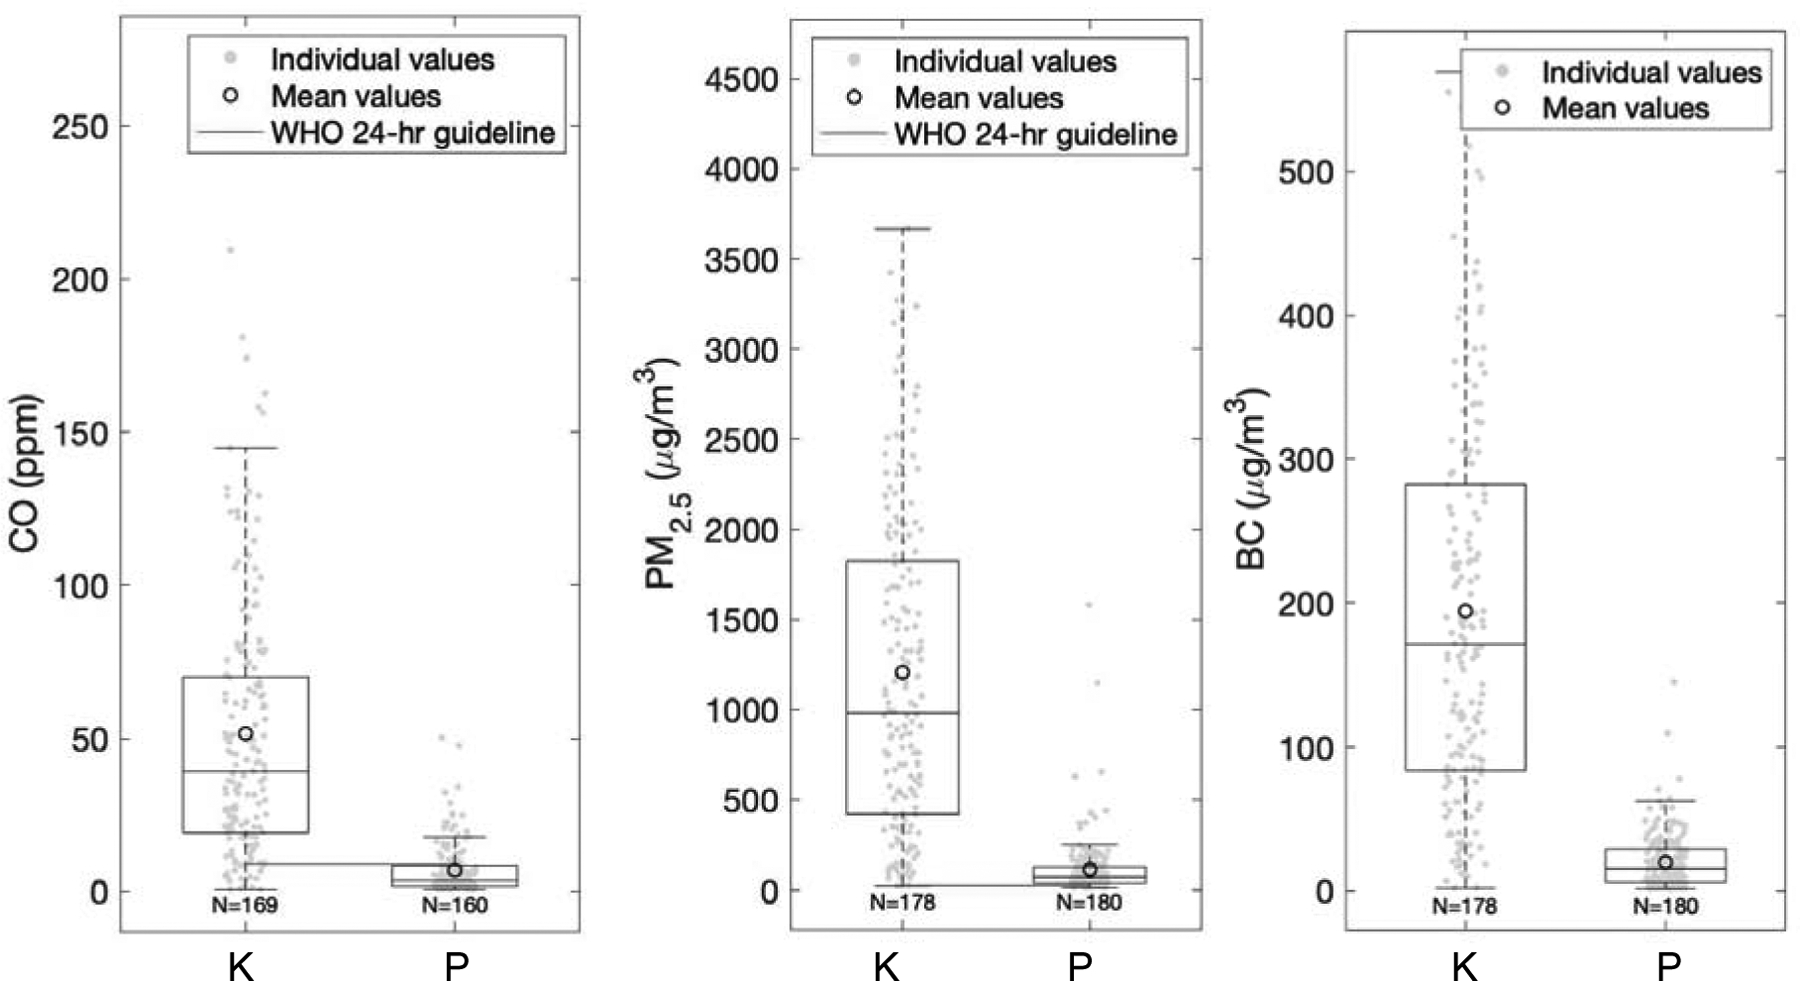
Figure 2.

Baseline 48-hour mean kitchen area concentrations (K) and personal exposures (P) box plots for CO, PM2.5, and BC. Interquartile ranges of the box plots represent the 25th and the 75th percentiles of the 48-hr means for each group; the middle line of the box represents the 50th percentile; the circle represents the average of the group; the sample size is indicated under each box plot. The red lines represent the WHO indoor 24-hour guideline for CO (9.4 ppm) and PM2.5 (25 μg/m3). There is no WHO indoor guideline for BC. Acronyms: BC: black carbon; PM2.5: fine particulate matter; CO: carbon monoxide, WHO: World Health Organization.
