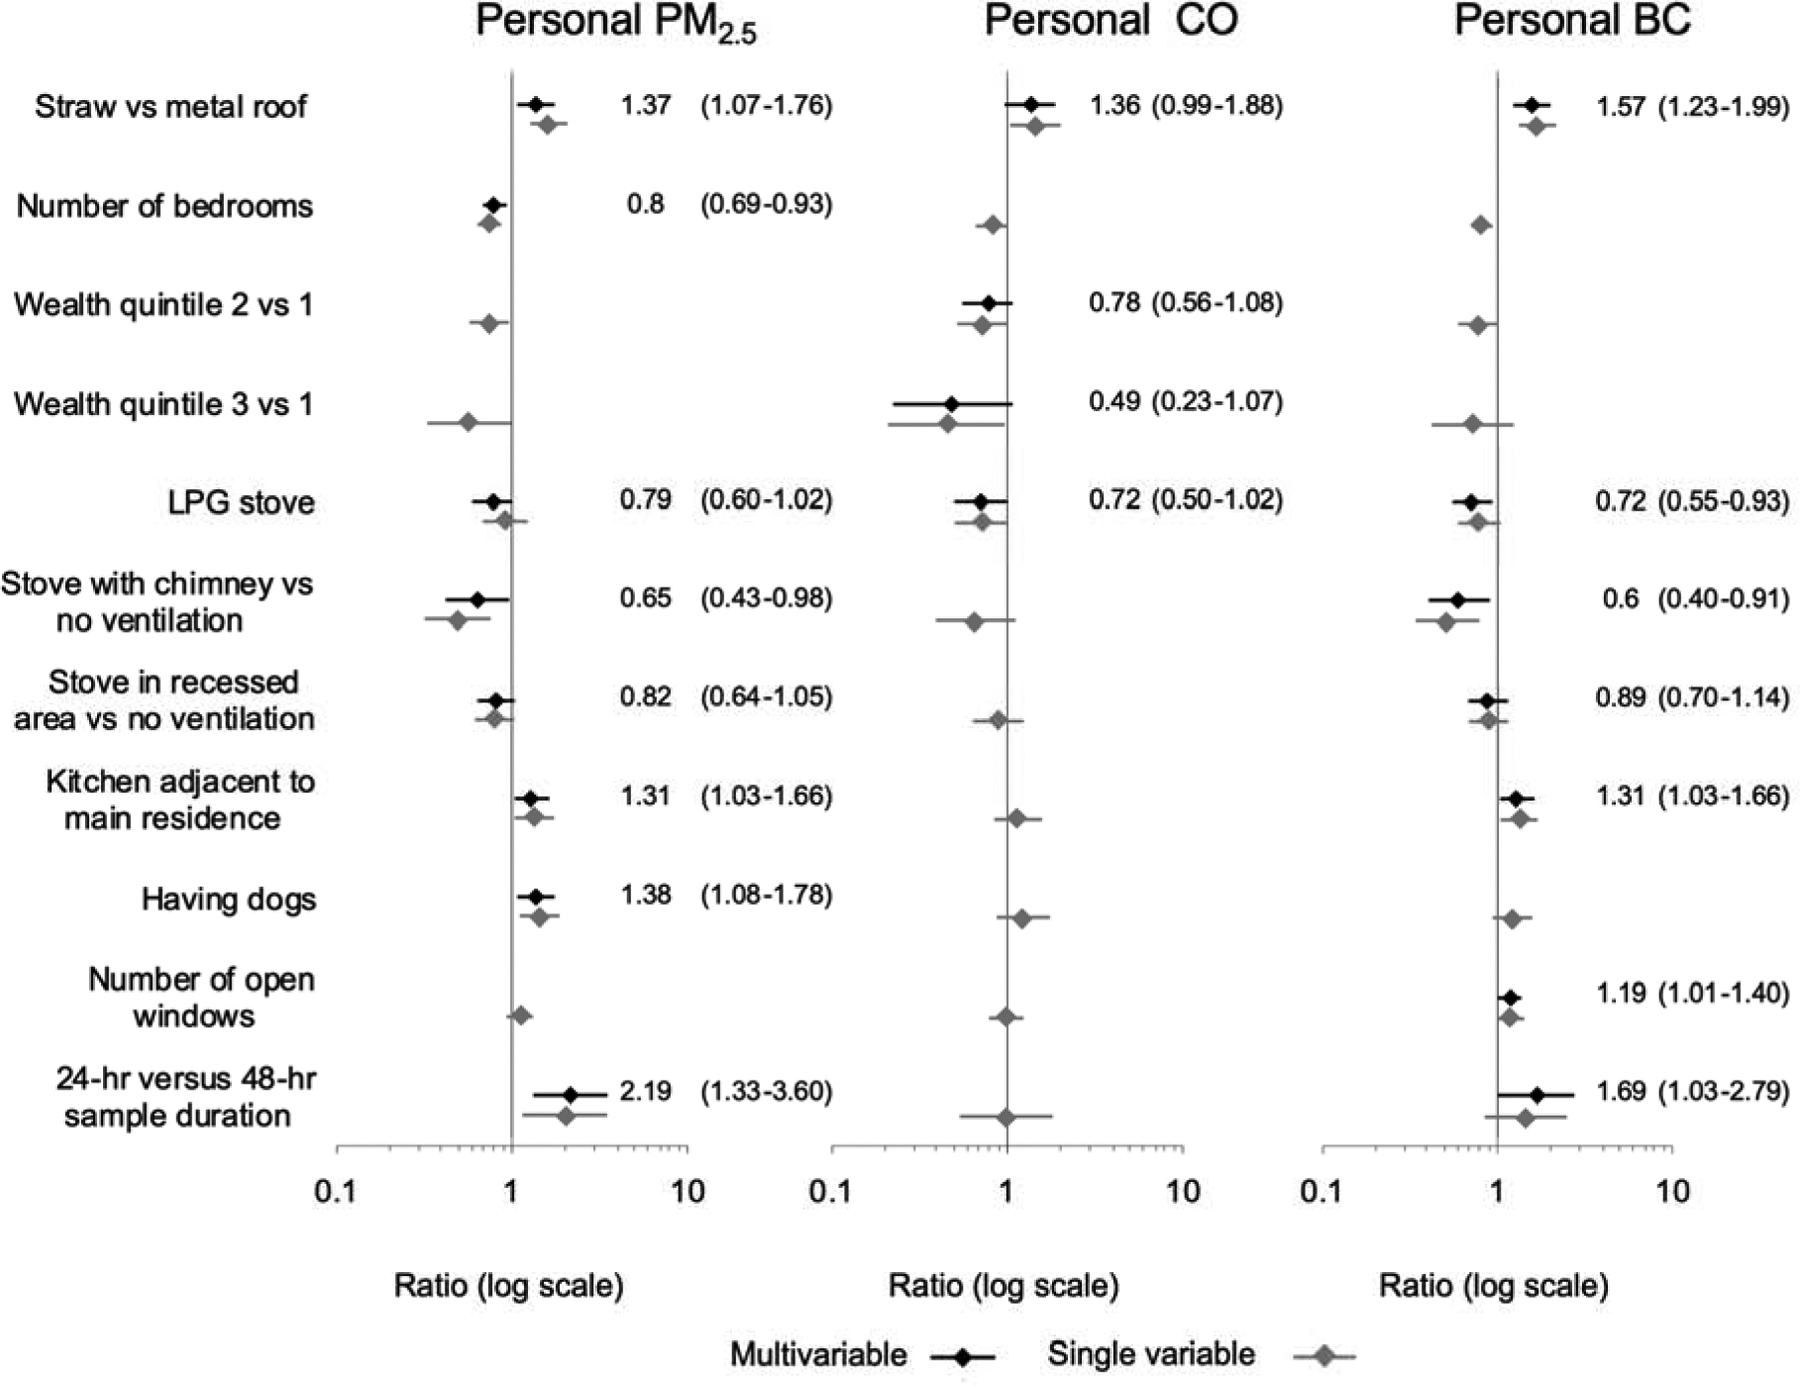
Figure 6.

Personal exposure forest plots of linear regression coefficient results of multivariable linear regression models of household variables (with 95% confidence intervals). Multivariable model results are shown in black with numeric coefficients and 95% CI; single variable regression coefficients are shown in lighter gray. Multivariable model covariates of each personal exposure pollutant: PM2.5 includes roof type, number of bedrooms, LPG stove, stove ventilation, kitchen with adjacent wall to the main residence, having dogs and samples with only the first 24 h; CO covariates include roof type, wealth quintile and LPG stove; BC covariates include: roof type, LPG stove, stove ventilation, kitchen with adjacent wall to the main residence, number of open windows and samples with only the first 24 h. Each of the regression model estimates represents the ratio of the geometric mean on the pollutant compared to the reference category based on the final multivariable linear regression models. For example, a ratio of 1.1 translates to 10% higher concentrations and a value of 0.9 translates in a 10% lower concentration compared to the reference category. Abbreviations: PM2.5: fine particulate matter; CO: carbon monoxide; BC: black carbon.
