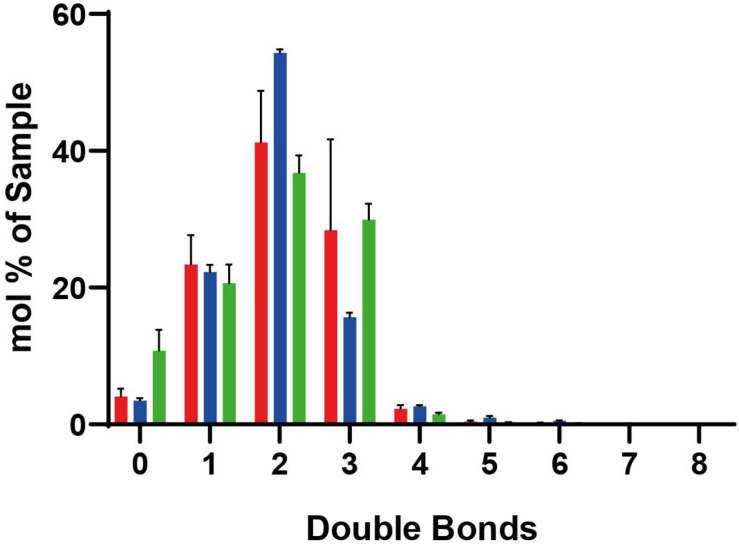
FIGURE 6.
Lipidomic data for lipids with different numbers of double bounds. In peroxisomes (red), mitochondria (blue), and ER (green). Standard deviations result from the three different measurements. Mole percentages of the total amount of lipids are shown on the y-axis (sum amount of a lipid species with the same double bond count divided by the total amount in the sample, multiplied by 100).

