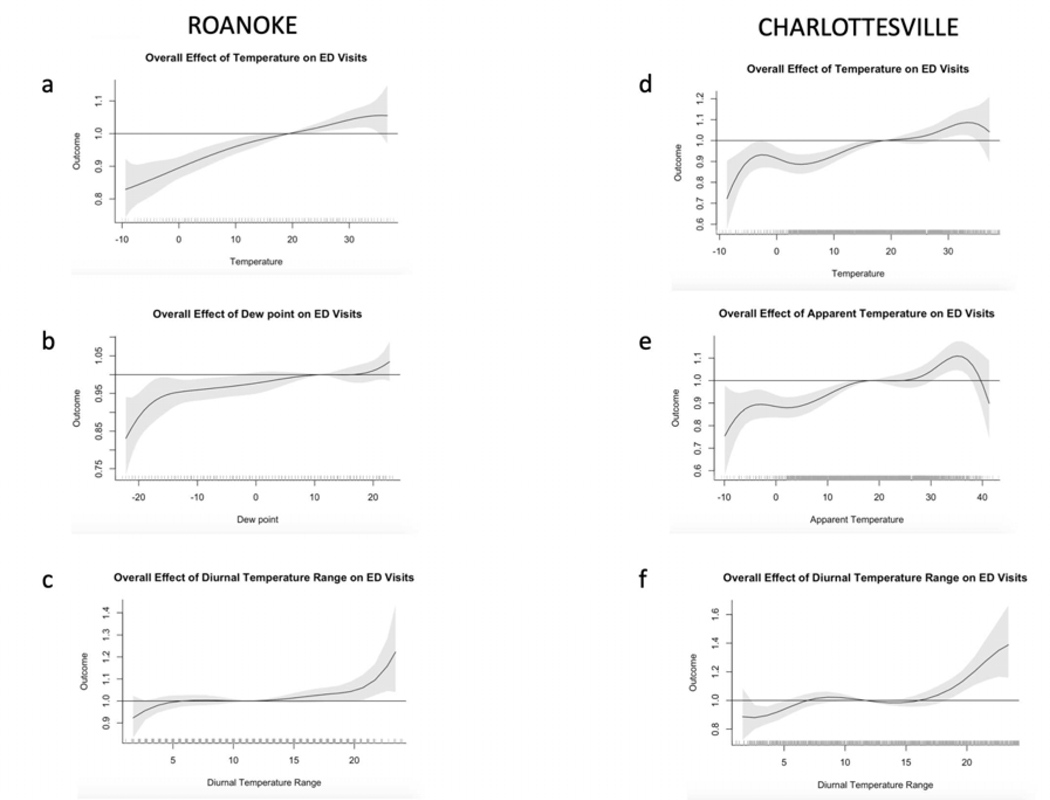
Figure 3.
Change in relative risk of ED visits over a 7-day period as a function of various weather variables at Roanoke (left) and Charlottesville (right). Tick marks along the x-axis indicate observations at those values. Shading indicates one standard error. The RR is centered at the median value of the predictand.

