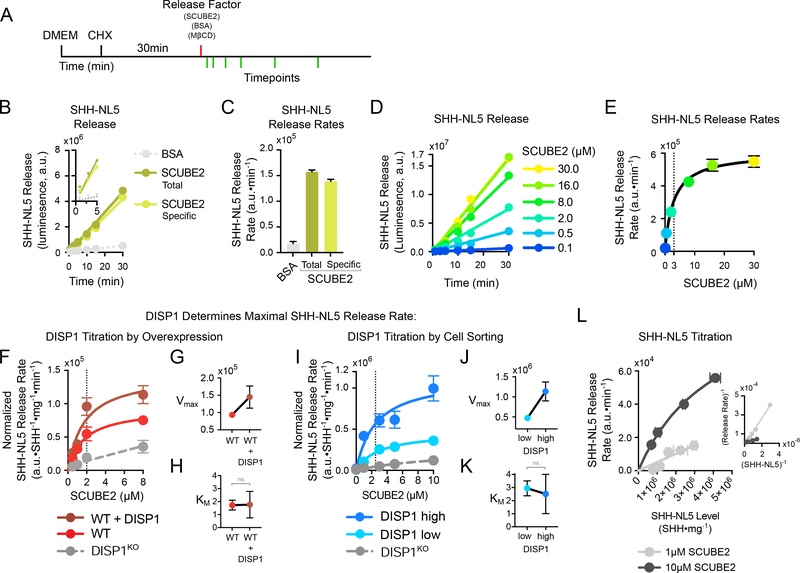
Figure 2.
DISP1 catalyzes SHH release from cells
(A) Schematic of the release assay. Cells stably expressing SHH-NL5 are washed of serum, and protein synthesis is inhibited by pre-incubation with cycloheximide (CHX). SHH-NL5 release is initiated by addition of purified SCUBE2, and SHH-NL5 in the media is measured at various time points, by NanoLuc luminescence. Bovine serum albumin (BSA) and methyl-β-cyclodextrin (MβCD) serve as controls.
(B) Kinetics of SHH-NL5 release by a fixed concentration of purified SCUBE2 (1μM). SCUBE2 strongly stimulates SHH-NL5 release, while BSA (1μM) has no effect. SHH-NL5 release by SCUBE2 is linear over the 30-minute duration of the experiment. Inset shows SHH-NL5 release can be robustly detected 1 minute after addition of SCUBE2.
(C) SHH-NL5 initial release rates. Data represent slope estimates in (B) with error bars showing standard error of the estimate.
(D) Time course of SHH-NL5 release by different concentrations of purified SCUBE2.
(E) SHH-NL5 initial release rates from the experiment in (D), plotted as function of SCUBE2 concentration. Data represent slope estimates and error bars standard error of the estimate. Data were fit to the Michaelis–Menten equation using least-squares, non-linear regression.
(F) As in (E), but with SHH-NL5 stably expressed in wild-type cells, DISP1KO cells, or cells overexpressing wild-type DISP1. Initial release rates were normalized to SHH-NL5 expression levels in each cell line, and to total cell numbers (total protein) in each experimental condition. SHH-NL5 initial release rates increase with increasing DISP1 levels, while displaying saturation relative to SCUBE2. Curves show fits either to the Michaelis–Menten equation, or to a line in the case of DISP1KO cells. Vertical dotted line shows KM estimate. See also Fig.S2D, E.
(G) Estimates of Vmax for the indicated conditions in (F). Error bars indicate standard error of the estimate.
(H) Estimates of KM for the indicated conditions in (F). Error bars indicate standard error of the estimate. ns. – not statistically significant
(I) as in (F), but with SHH-NL5, DISP1-expressing cells sorted into low- or high-expressers. See also Fig. S2F, G.
(K) as in (G), but with data from (I).
(J) as in (H), but with data from (I).
(L) SCUBE2-dependent SHH-NL5 release as a function of increasing SHH-NL5 levels. Variable amounts of SHH-NL5 were expressed in cells with endogenous DISP1 and initial release rates recorded for low (1μM) and high (10μM) SCUBE2. At high SCUBE2 concentrations, release saturates as a function of SHH-NL5 level, as indicated by good hyperbolic fit (R2=0.998). Inset shows Lineweaver–Burk plot of the data with accompanying linear fits (R2=0.996 and R2=0.995 for low and high SCUBE2 respectively). Data represent rate estimates versus mean SHH-NL5 level. Vertical error bars represent standard error of the estimate; horizontal error bars represent standard deviation of the mean. See also Fig.S2O.
See also Figure S2 for additional characterization of SHH-NL5 release.

