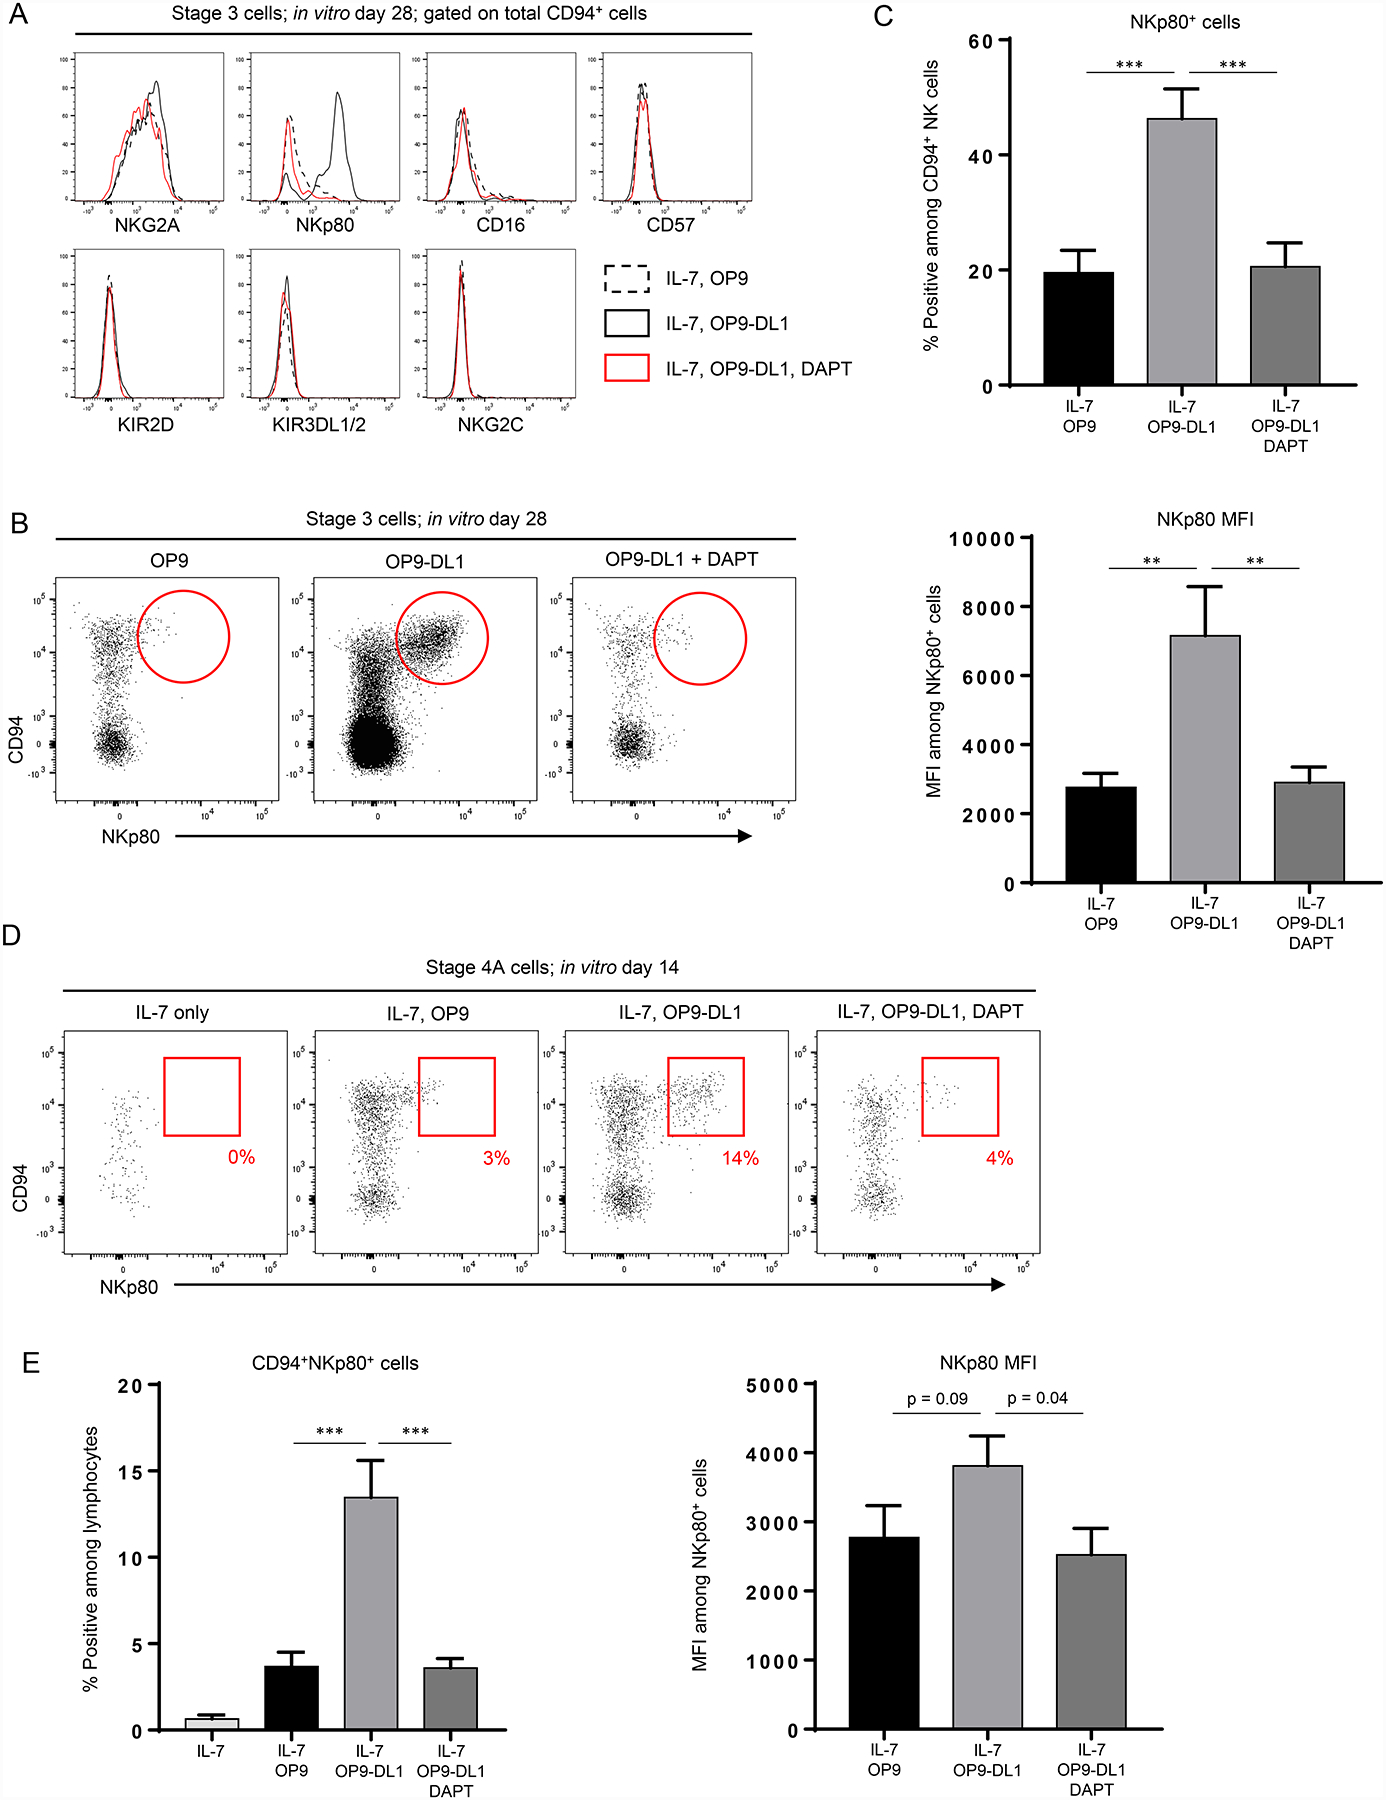
Figure 3.

NKp80 expression is increased in vitro following co-culture with OP9-DL1 stroma. (A) Representative (n ≥ 4 for each marker) flow cytometry analyses of total CD94+ cells generated in vitro following 28 day culture of freshly purified tonsil-derived stage 3 cells with IL-7 + OP9 cells (dotted black histogram) or IL-7 + OP9-DL1 cells in the presence of either vehicle (solid black histogram) or DAPT (red histogram). (B) Representative (n = 16; 5 independent experiments) flow cytometry analyses of CD94+NKp80+/− populations generated in vitro following 28 day culture of freshly purified tonsil-derived stage 3 cells with IL-7 + OP9 or OP9-DL1 in the presence of either vehicle or DAPT. Red circles denote a qualitative increase of the CD94+NKp80+ population in the presence of Notch activation (middle panel). (C) Top, quantification of NKp80+ cells among in vitro-derived CD94+ cells generated from stage 3 cells cultured in the conditions described in (B). Bottom, mean fluorescence intensities (MFIs) of NKp80 among in vitro-derived NKp80+ cells from stage 3 cells cultured in the conditions described in (B). Data are represented as mean ± SEM. ** p < 0.01; *** p < 0.001. (D) Representative (n = 14; 4 independent experiments) surface flow cytometry analyses of ILCs generated in vitro following 14 day culture of freshly purified tonsil-derived stage 4A cells with IL-7 alone, IL-7 + OP9 cells, or IL-7 + OP9-DL1 cells and treated with either vehicle or DAPT. (E) Left, quantification of CD94+NKp80+ cells as a percentage of total in vitro-derived live CD45+ lymphocytes generated in vitro following 14 day culture of freshly purified tonsil-derived stage 4A cells in the conditions described in (D). Right, mean fluorescence intensities (MFIs) of NKp80 among in vitro-derived NKp80+ cells from stage 4A cells cultured in the conditions described in in (D). Data are represented as mean ± SEM. *** p < 0.001.
