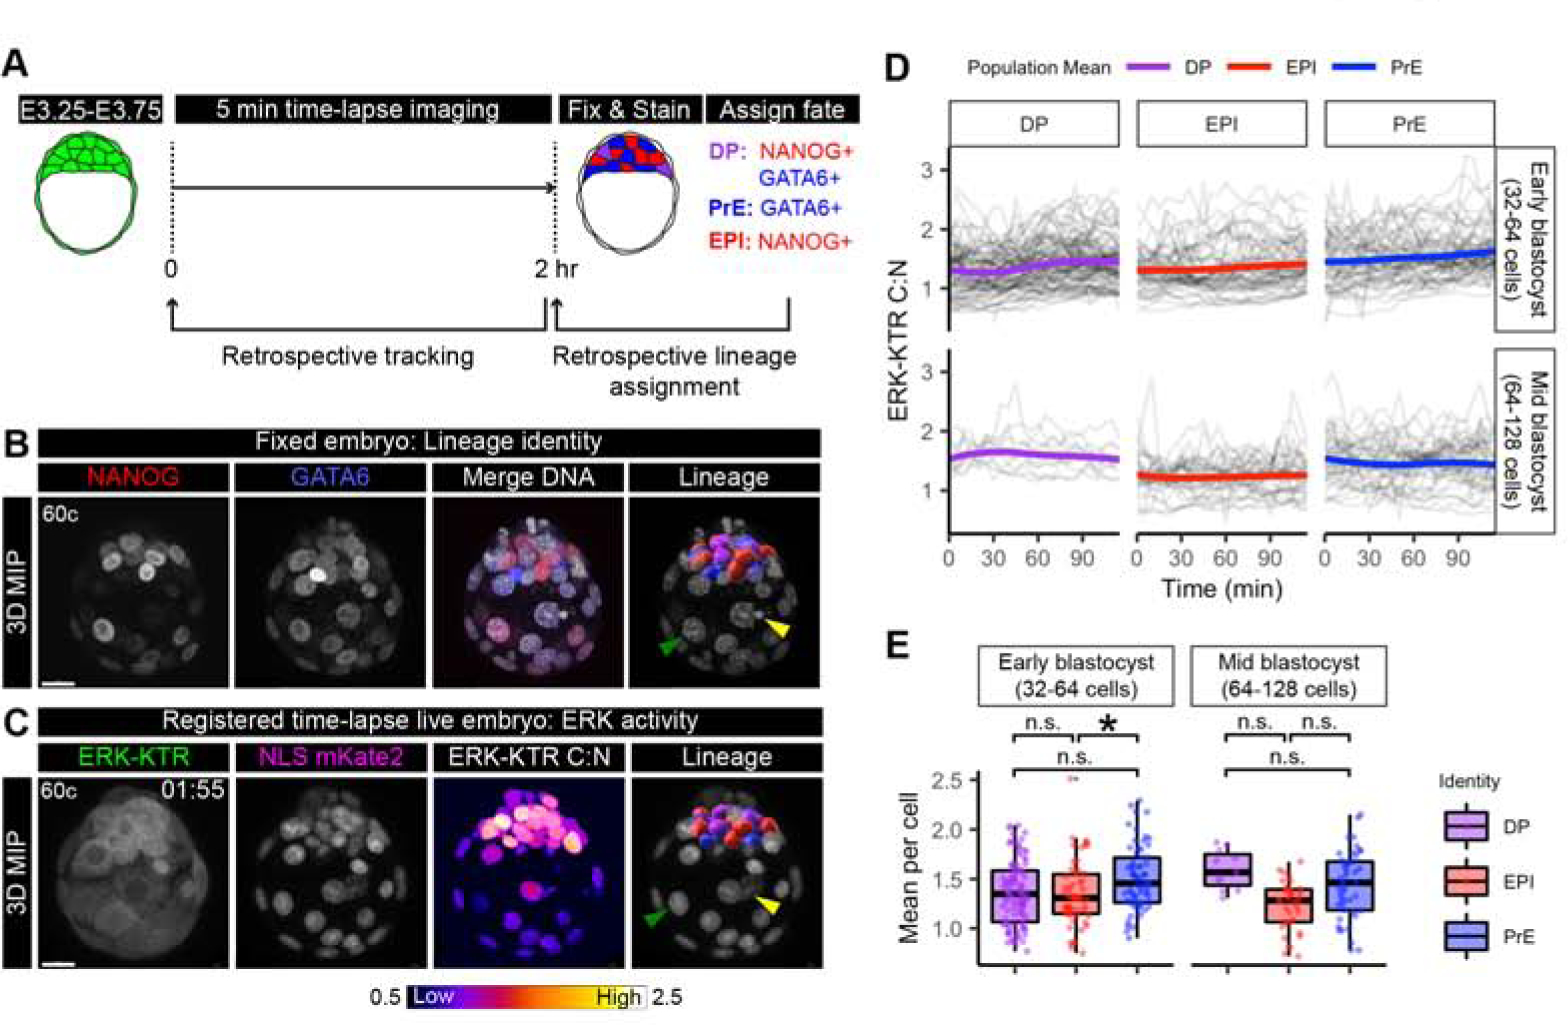
Figure 4: Signaling heterogeneity between ICM cells corresponds to lineage identity.

(A) Schematic of time-lapse confocal imaging as in (Figure 3C). Embryos were fixed immediately after the end of the time lapse and stained to retrospectively identify inner cell mass (ICM) lineages. ICM progenitors are double positive (DP) for NANOG and GATA6. DP cells are specified to primitive endoderm (PrE) GATA6+ cells, and Epiblast (EPI) NANOG+ cells. (B) Max intensity projection (MIP) confocal image of an embryo stained for NANOG (red) and GATA6 (blue). Merge with Hoechst (grey) to label nuclei. Lineage includes 3D rendering in Imaris (Bitplane) corresponding to a cell’s lineage identity after k-means clustering of relative NANOG and GATA6 levels (Saiz, et al., 2016b). DP: purple, PrE: blue, EPI: red. Merged with Hoechst (grey) to show nuclei. Arrows indicate landmarks within trophectoderm (TE) used for manual image registration with final time frame of time-lapse. Yellow: apoptotic cell, Green: Mural TE. Scale bars: 20μm. (C) Max intensity projection of hemizygous HprtERK-KTR and homozygous R26NLS-mKate2 embryos in final time frame of 2 hour time-lapse movie. ERK-KTR C:N heatmap showing level of ERK activity. Retrospective ICM lineage identification when manual registered to fixed and stained (B) arrows indicate the same landmarks. Lineage is a 3D rendering in IMARIS colored corresponding to retrospective lineage identification (DP: purple, PrE: blue, EPI: red) merged with NLS mKate2 (grey) to show nuclei. (D) Traces of single-cell ERK-KTR C:N values over the course of the 2 hour time-lapse imaging. Single-cell traces are shown in black. Population means are overlaid in color corresponding to lineage identity. Stage of embryo at the beginning of the movie is indicated, early blastocyst (32–64 cell) stage and mid-blastocyst (64–128 cell) stage. (E) Boxplot showing integrated ERK activities in individual ICM cells over the 2 hour time-lapse imaging period. Mean ERK-KTR C:N values per cell are shown for every cell as individual points. Color coding for lineage as indicated before. Asterisk indicates statistical significance (linear mixed effects model, post-hoc Tukey pairwise test, see STAR Methods). Early blastocyst stage EPI-PrE p=0.0271 n=14 embryos. Mid-blastocyst stage: n=8 embryos. Not significant (n.s.) pairwise comparisons indicated where p > 0.05.
