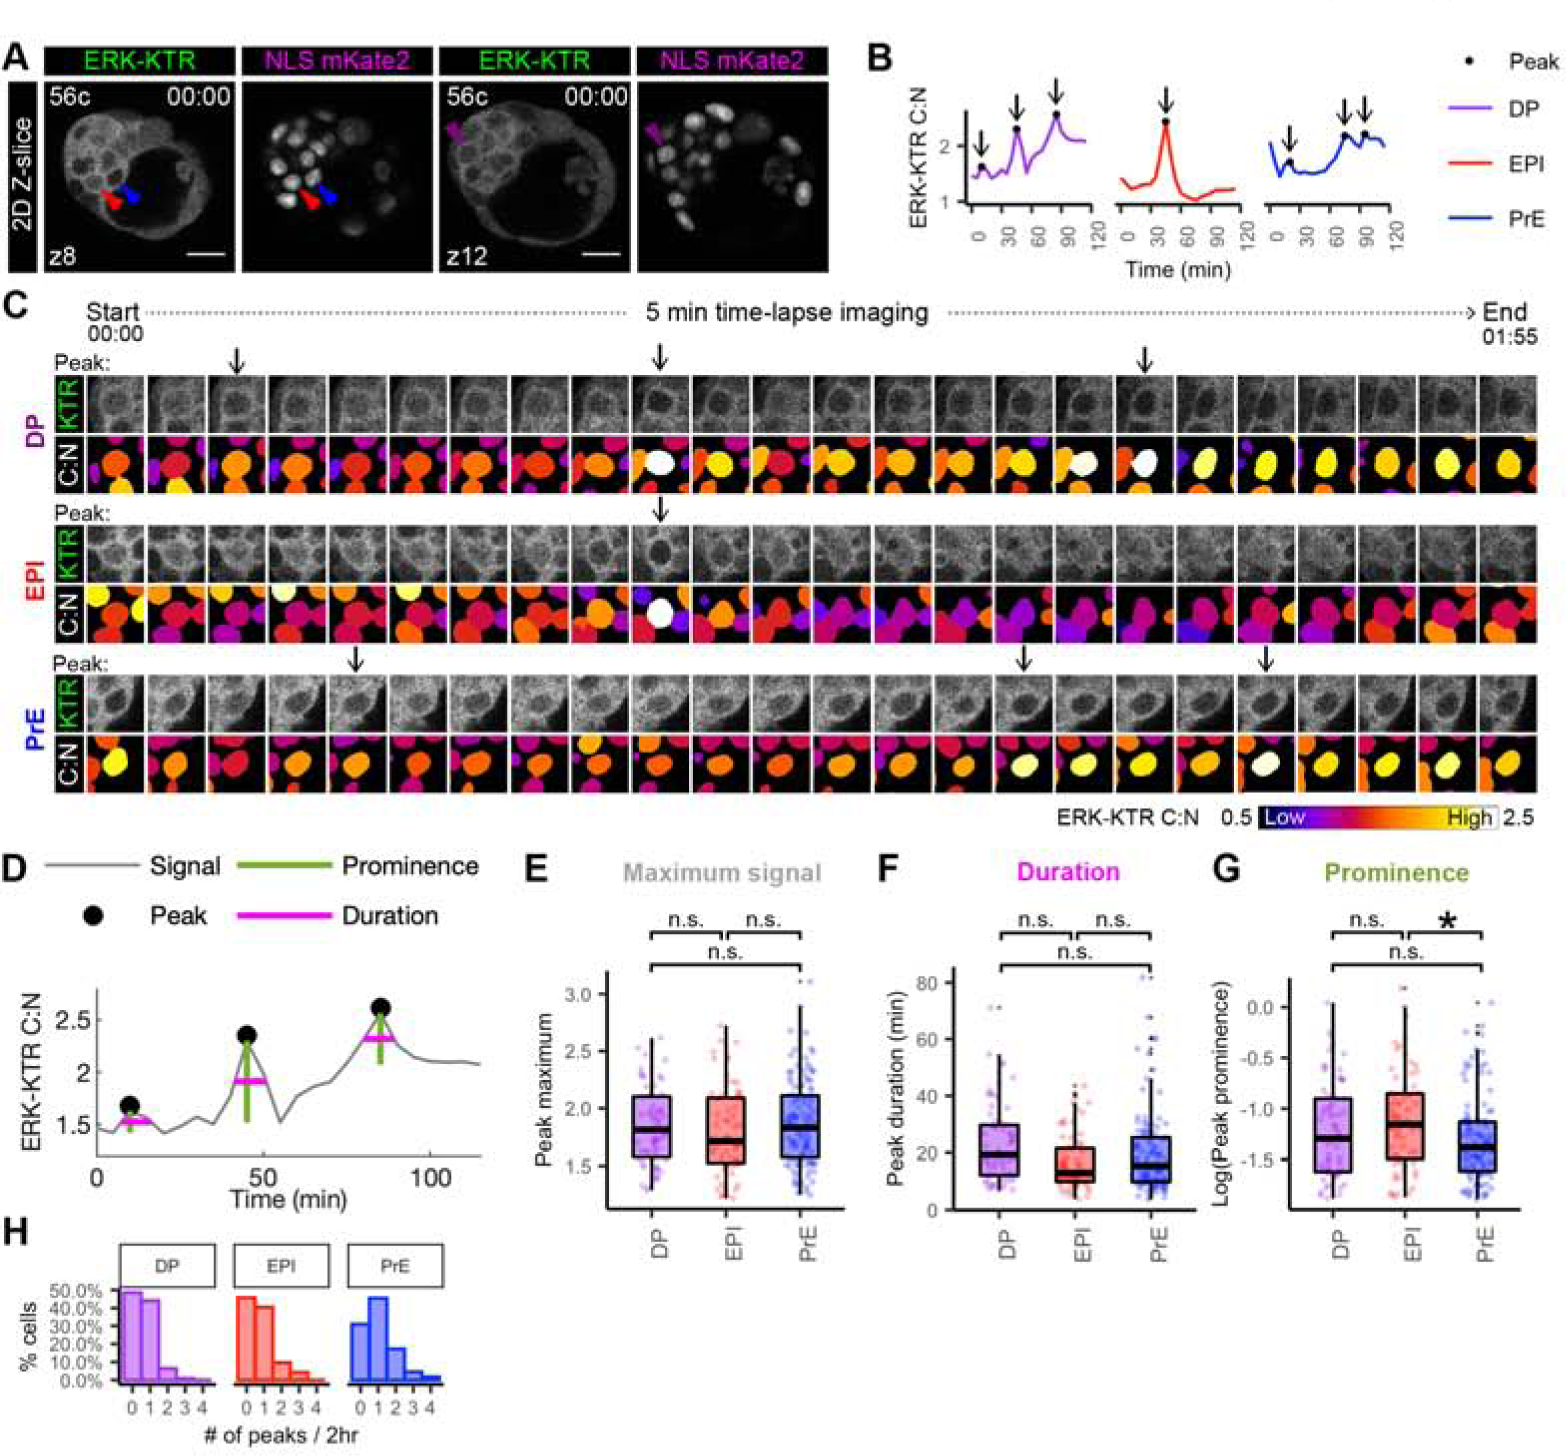
Figure 5: Lineage-specific dynamics of ERK activity in ICM cells.

(A) Single Z-slice of hemizygous HprtERK-KTR and homozygous R26NLS-mKate2 embryos at beginning of 2 hour 5 min time-lapse movie (Figure 4A). Cell number and position of z-slice is shown. Arrowheads indicate cells shown in traces (B) and sequential frames (C). (B) Single-cell traces of ERK-KTR C:N over 2 hour time-lapse. Color coding indicate lineage as shown. Arrows indicate peaks. (C) Sequential frames of example DP, EPI and PrE cells from the same embryo shown in A. ERK activity illustrated by C:N heatmap. Arrows indicate peaks. (D) Peak calling (of the example DP trace from the embryo shown in A) to extract dynamic information from individual traces. Peaks identified as local maxima. Prominence is peak height relative to nearest minima. Duration is width at half prominence. (E-G) Boxplot showing dynamic information extracted from peak-calling (D) Each peak is shown as individual points. Color coding for lineage as indicated before. Asterisk indicates statistical significance. Prominence EPI versus PrE p=0.016 (Wilcoxon test, Bonferroni adjustment). n=22 embryos. Not significant (n.s.) pairwise comparisons indicated where p > 0.05. (E) Histogram showing the number of peaks detected within each cell as a percentage of cell in that lineage.
