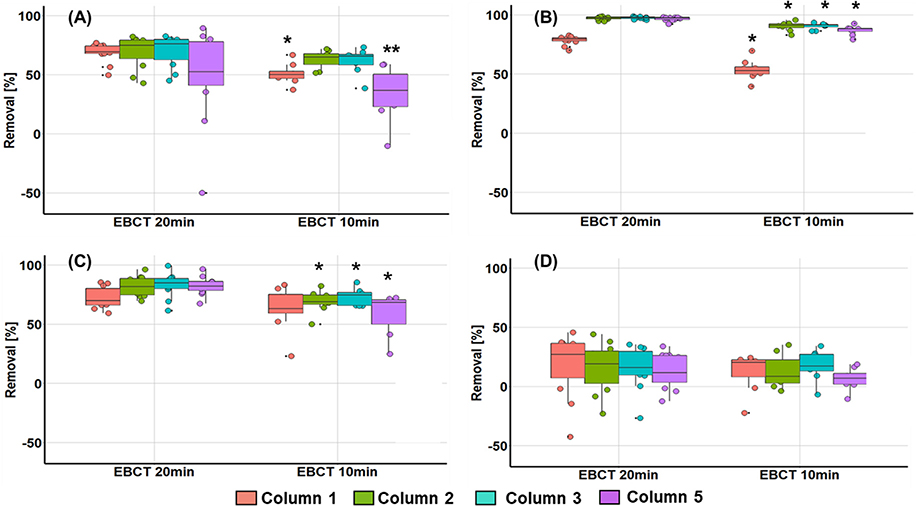
Fig. 2.
Box-and-whisker plots showing percent reduction of maximum fluorescence intensities (Fmax) of PARAFAC components through the BAF systems; column 1 (filter biomass inoculated and operated w/o AOM), column 2 (filter biomass inoculated and operated w/AOM), column 3 (no inoculation and operated w/AOM), and column 5 (no inoculation and operated w/regular autoclaving and AOM); The whiskers indicate the max and min. The box stretches from the lower hinge (25th percentile) to the upper hinge (75th percentile). The median is shown as a line across the box; (A): Component 1 (marine humic-like substances), (B): Component 2 (terrestrial humic-like substances), (C): Component 3 (protein-like substances with tryptophan-like substances), (D): Component 4 (protein-like substances with tyrosine-like substances); * indicates P < 0.05 based on Welch’s t-test between EBCT 20 min and 10 min, ** indicates P < 0.05 based on Welch’s t-test between biological (columns 2 and 3) and sterilized (column 5) columns.

