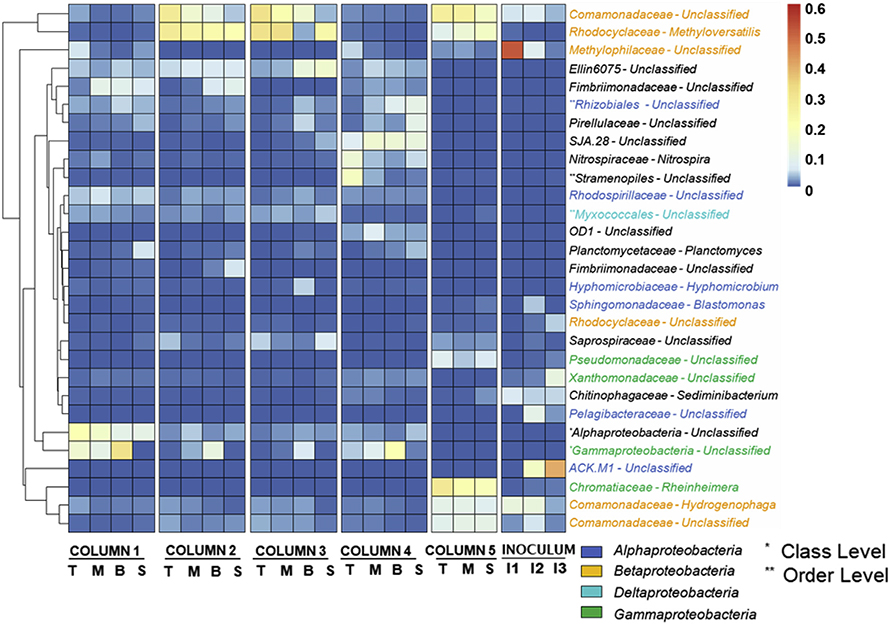
Fig. 5.
The heatmap of genera with relative abundances >4%. Abbreviations: T: top GAC samples; M: middle GAC samples; B: bottom GAC samples; S: sand samples; I1: Influent (during slow filtration); I2: Influent (during rapid filtration); I3: Inoculated biomass. Column 1 was operated w/o AOM/MC-LR and column 4 was disassembled at day 159 before the addition of AOM/MC-LR. Columns 2, 3, and 5 were exposed to AOM/MC-LR.

