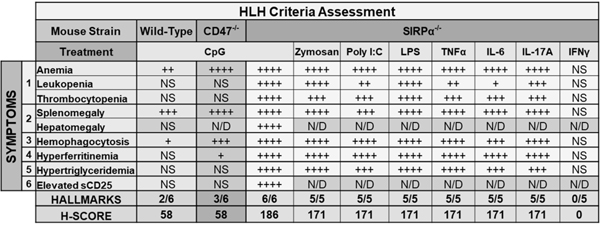
Fig. 7. Summary of HLH phenotype in mice with varied treatments.

Six or five hallmarks were assessed in CpG-treated or other inflammatory stimuli-treated mice, respectively, in accordance with the HLH-2004 diagnostic criteria. An H-score ≥169 accurately classifies 90% of individuals and corresponds to a sensitivity of 93% and specificity of 86% for HLH diagnosis. NS, not significant = P > 0.05; + = P < 0.05; ++ = P < 0.01; +++ = P < 0.001; ++++ P < 0.0001; ND, not determined.
