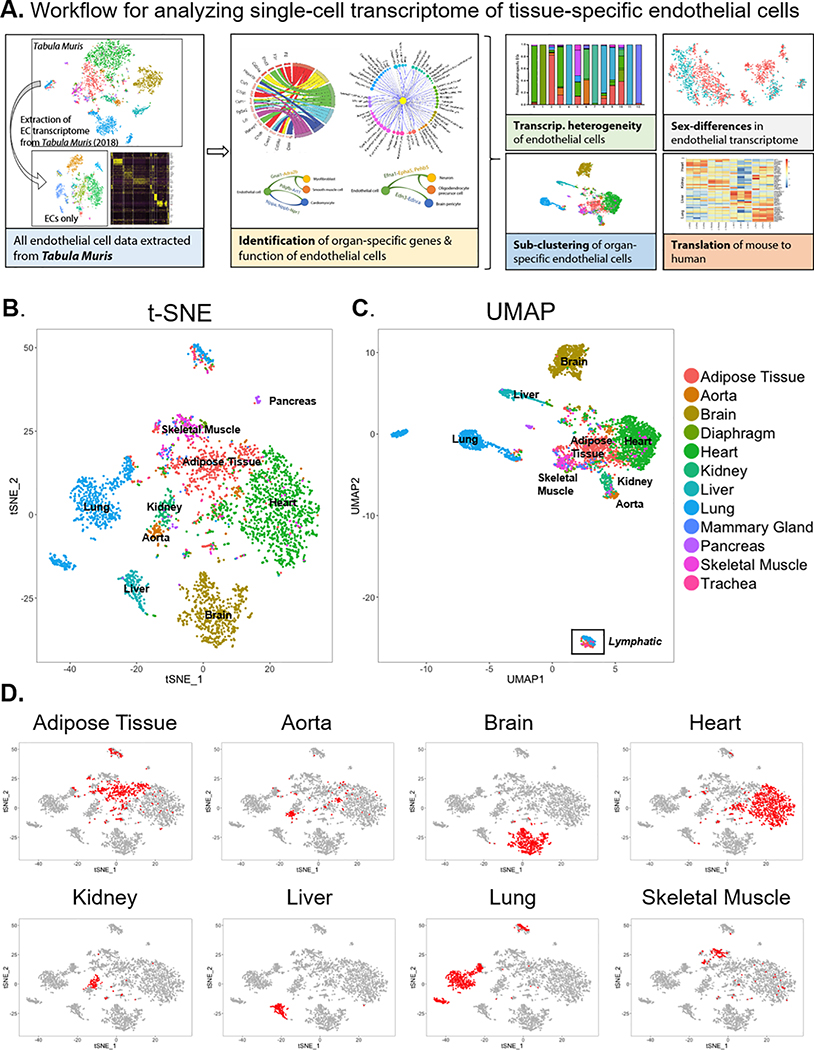
Figure 1. Single-cell transcriptome of endothelial cells in 12 major organs extracted from the Tabula Muris dataset.
(A) Experimental workflow for analyzing single-cell transcriptomes of tissue-specific endothelial cells (ECs). Projection of ECs onto (B) t-distributed Stochastic Neighbor Embedding (t-SNE) and (C) Uniform Manifold Approximation and Projection (UMAP) plots. ECs are color-coded by their tissue of origin. (D) Location of organ-specific ECs for 8 major individual organs on the t-SNE plot.

