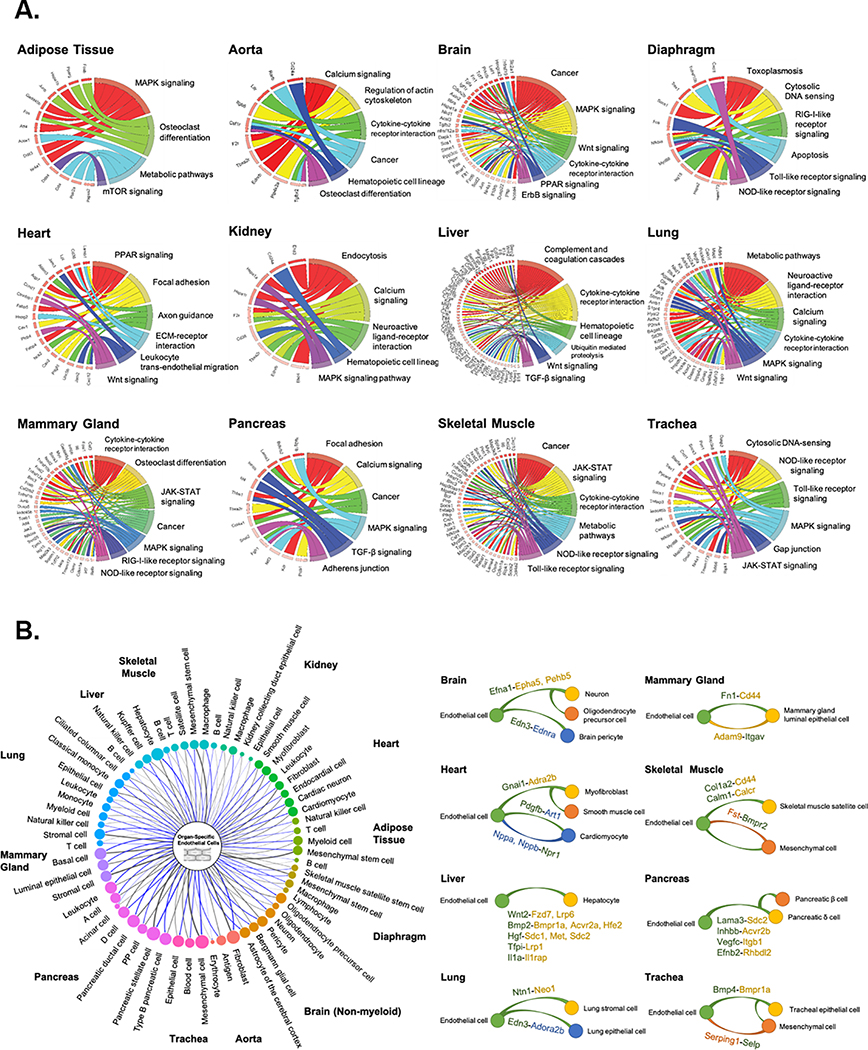
Figure 3. Pathway enrichment and angiocrine relationship prediction analyses.
(A) Kyoto Encyclopedia of Genes and Genomes (KEGG) pathway enrichment analysis of DEGs of tissue-specific ECs reveals unique organ-specific EC genes in signaling and cellular pathways, shown in chord plots. (B) Predicted angiocrine relationships between organ-specific ECs (left, center) and parenchymal cells (left, perimeter) from the same organ. Relationships are determined by expression of a secreted ligand in one cell type and its corresponding receptor in another. The thickness of connecting lines and size of bubbles indicate the number of ligand-receptor pairs. Representative organ-specific ligand-to-receptor pairs are shown for 8 major organs (right). In the representative pairs shown, the ligand is written as the former and the receptor as the latter followed by a dash. Cell type which expresses each gene is noted by the color. Green represents endothelial cells and yellow, orange, and blue represent parenchymal cell types in each organ as shown.

