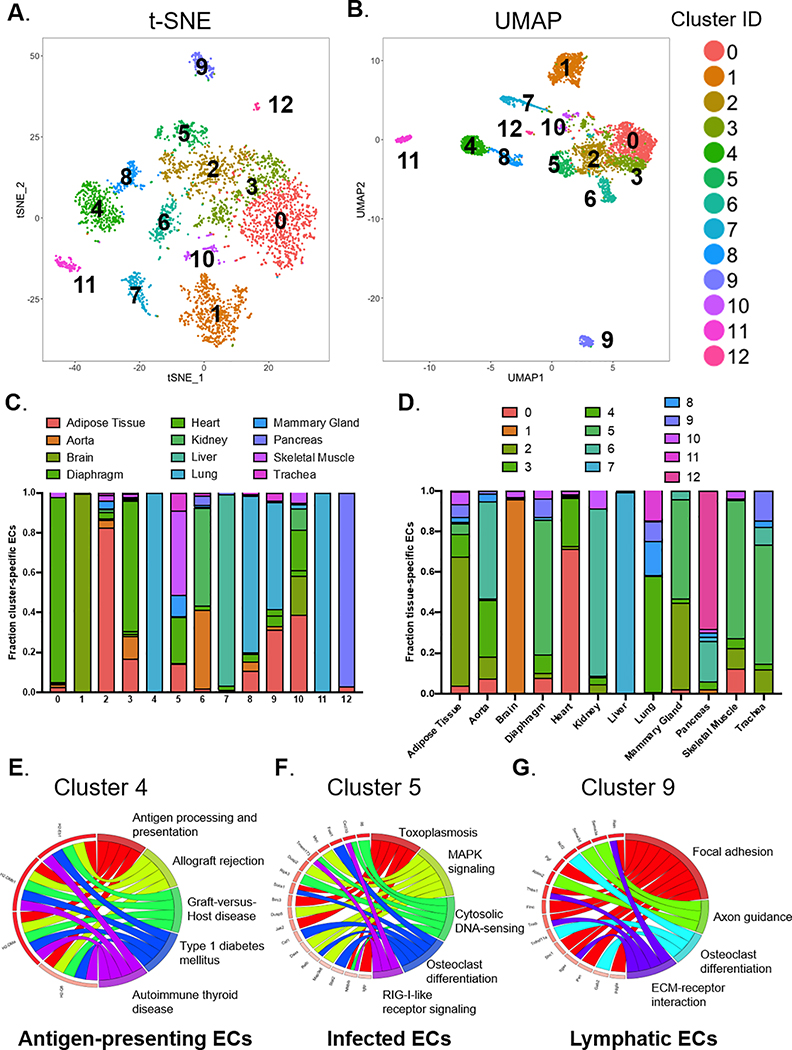
Figure 4. Unsupervised clustering to reveal subpopulations of ECs.
13 individual clusters (numbered 0 to 12) identified from a graph-based unsupervised clustering approach are shown in (A) t-SNE and (B) UMAP plots. (C) Proportion of ECs originating from different organs in each of the unsupervised clusters. (D) Proportion of ECs from unsupervised clusters in each of the 12 major organs. Based on KEGG pathway enrichment analysis of DEGs for each cluster, (E) “Cluster 4” represents antigen-presenting ECs, (F) “Cluster 5” represents infected ECs, and (G) “Cluster 9” represents lymphatic ECs.

