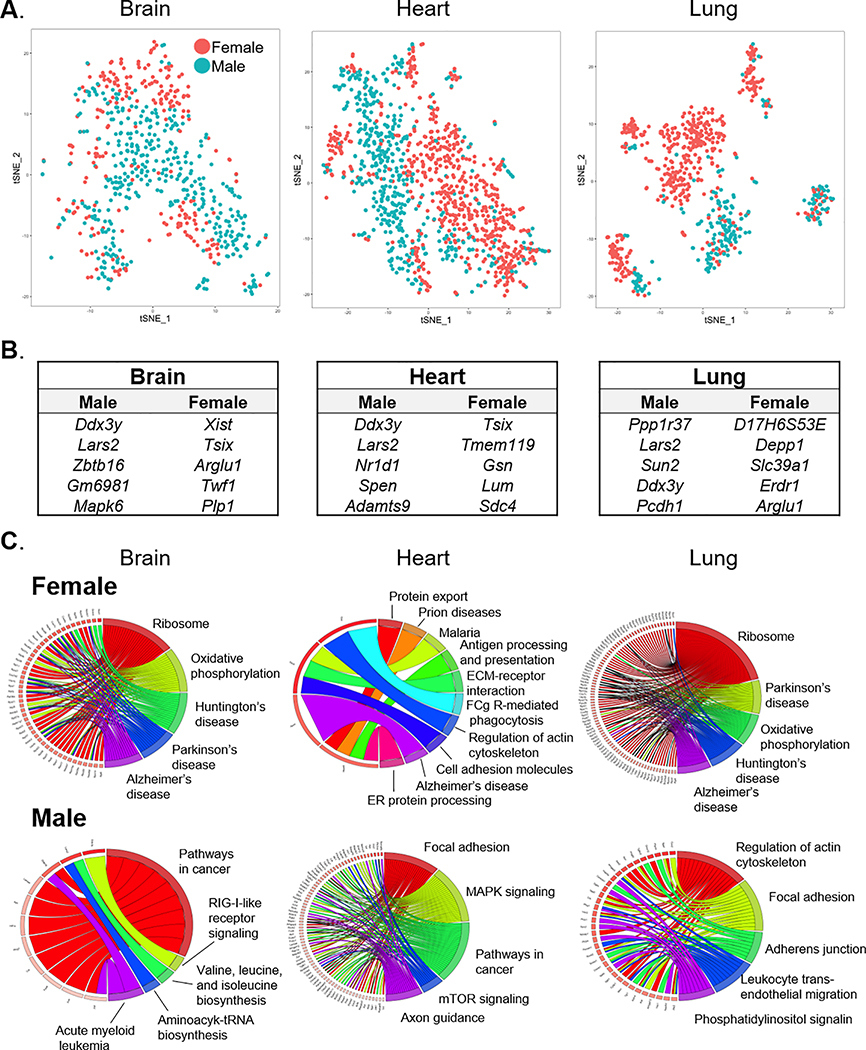
Figure 5. Sex differences in tissue-specific EC gene expression.
(A) Projections of ECs from brain, heart, and lung onto t-SNE maps color-coded by sex. (B) List of genes differentially expressed between male and female ECs in each organ. (C) KEGG pathway enrichment analysis of sex- and organ-specific DEGs show correlation of sex-dependent genes in ECs with organ-specific disease and/or cellular pathways.

