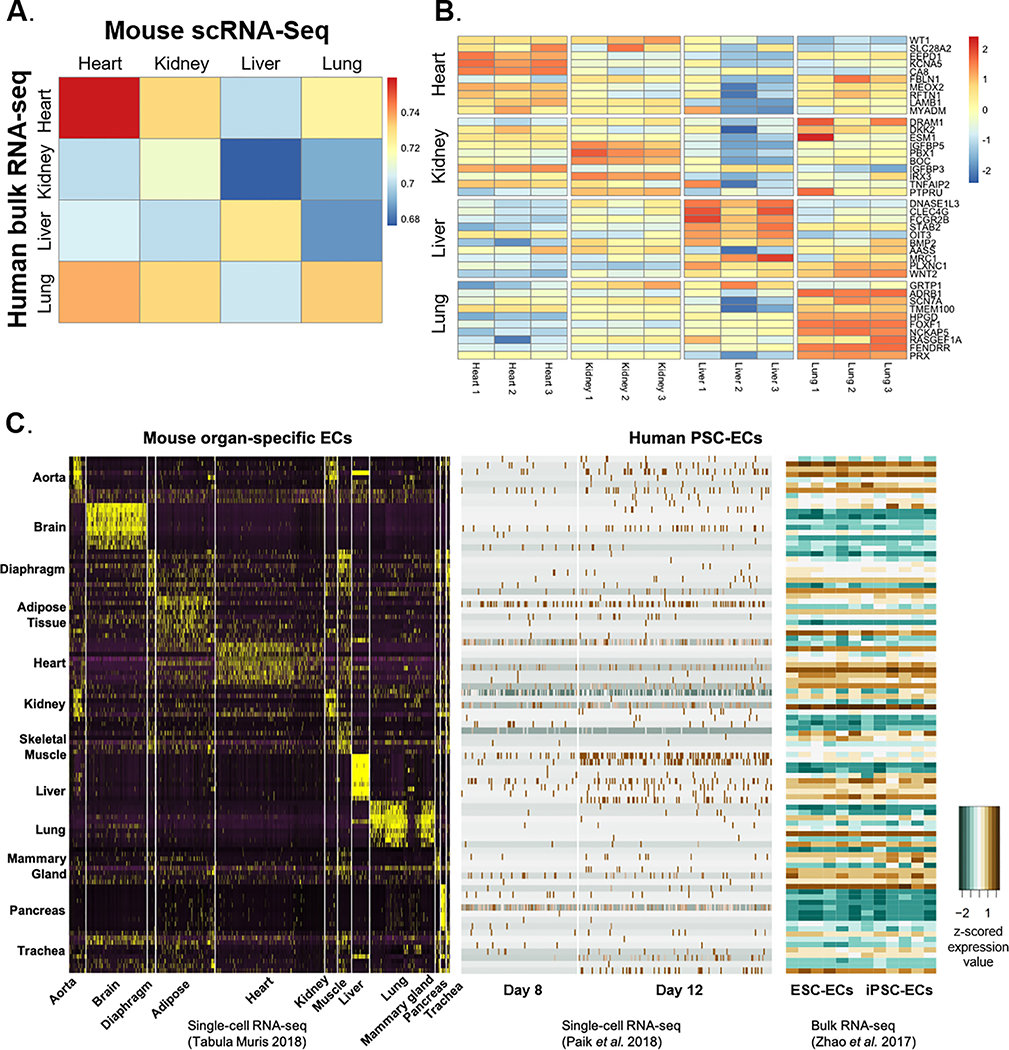
Figure 7. Mouse-to-human translation of organ-specific EC transcriptome.
(A) Correlation between murine EC gene expression with the corresponding human organ obtained from a previously published dataset (Marcu et al., 2018)23. Heatmap shows Spearman’s rank correlation coefficients. (B) Expression values (log counts per million) of murine organ-specific EC DEGs in the corresponding human organ-specific ECs (Marcu et al., 2018)23. (C) z-scored expression value of DEGs in organ-specific ECs from mice are assessed in human induced pluripotent stem cell-derived EC transcriptome obtained from the published single-cell (Paik et al., 2018)40 and bulk (Zhao et al., 2017)41 RNA-seq datasets.

