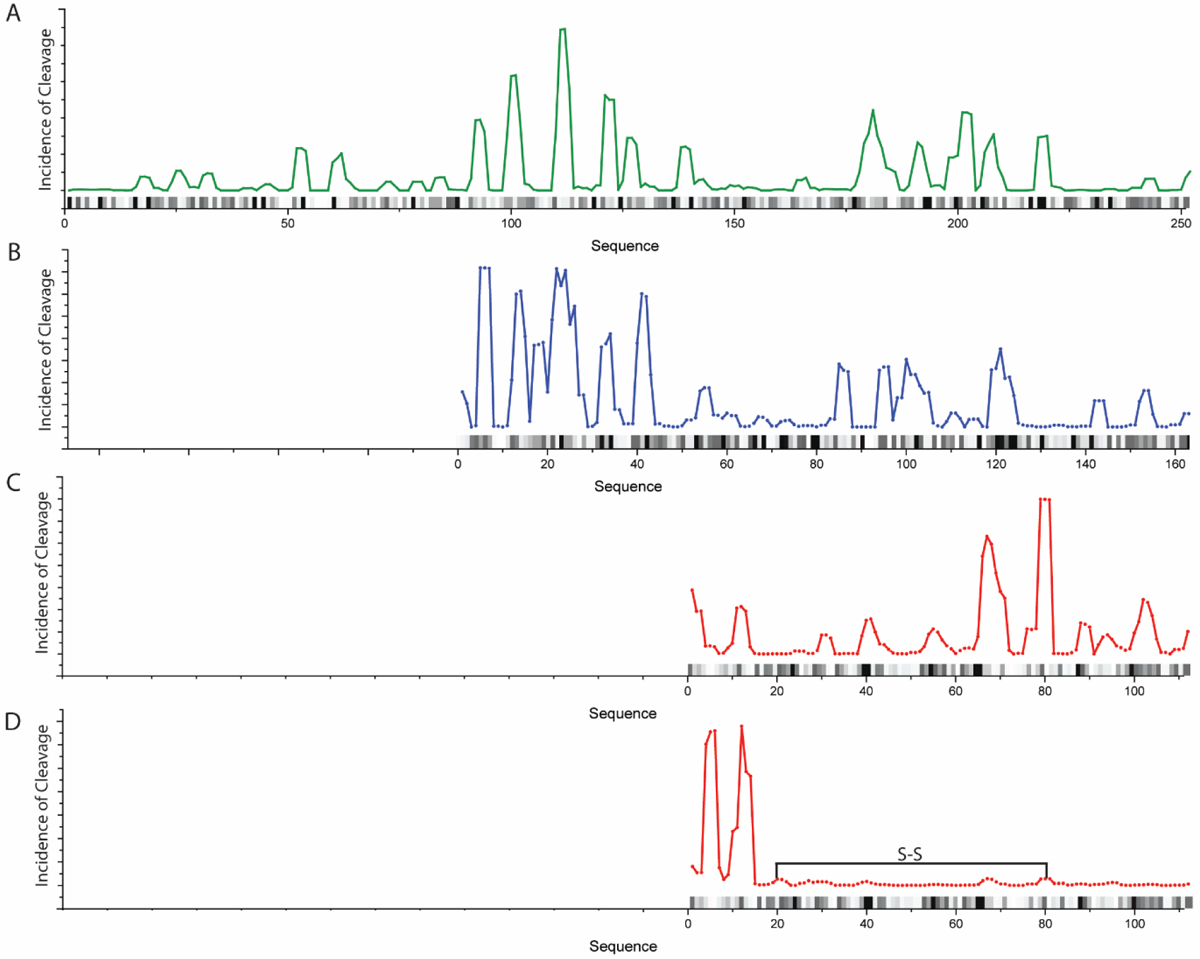
Figure 3:

Cleavage incidence locations on the studied substrates weighted for mass spectral intensity. (A) GFP, (B) RcdA, (C) reduced β2m and (D) oxidized β2m. The location of the disulfide bond is depicted as a black line. Data were subject to a moving average smoothing over 3 data points. The black and gray bars on each graph represent primary sequence cleavage specificity, where darker colors indicate higher likelihood of cleavage.
