Fig. 1.
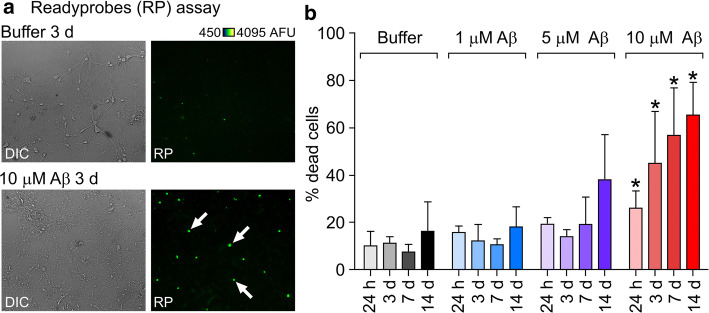
Aβ42 oligomers cause death of primary neurons in a dose and time-dependent manner. a Example widefield images following treatment of cells incubated either with buffer or 10 μM Aβ42 oligomers for 3 days with Readyprobes reagent. Left panels are brightfield images showing deteriorated cell morphology in oligomer-treated cultures. Right panels are the same region through the green filter, showing dead cells labelled with the green reagent, which stains the nuclei of cells with compromised plasma membrane integrity. More green, i.e. dead cells can be seen in oligomer treated cultures (white arrows). b Assessment of oligomer toxicity by Readyprobes cell viability assay. Data shown are averages from three FOV (fields of view) in at least three experiments ± SEM (standard error of the mean). Unpaired student’s t test; significant differences versus buffer are indicated by *(p < 0.05). DIC differential interference contrast, AFU arbitrary fluorescence units

