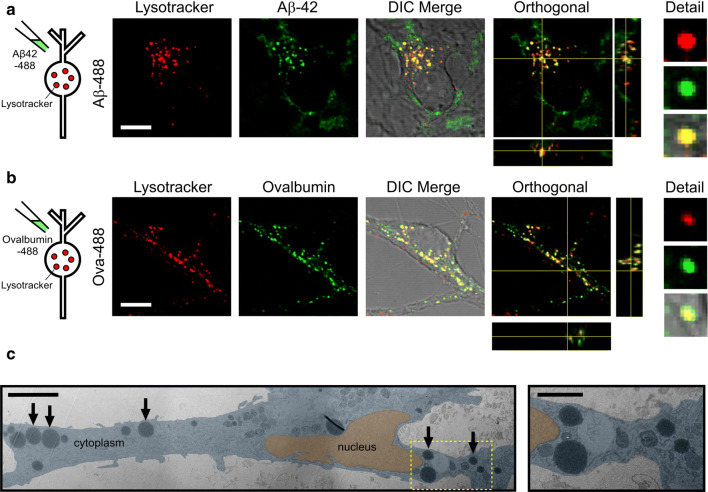
Fig. 3.
Aβ42 oligomers are trafficked to lysosomes. Co-labelling with Lysotracker red shows that Aβ42-488 oligomers (a) localise to lysosomes with a similar distribution to 488-labelled ovalbumin (b). Orthogonal views also show green and red signal colocalisation in x, y and z. Cells were treated with either 10 μM Aβ42-488 oligomers for 24 h or 100 μg/mL Ovalbumin-488 for 3 h. Scale bar is 10 μm. c (left panel) Aligned and overlaid transmission electron microscopy images of a section through a neuron treated with 5 μM Aβ42 oligomers for 14 days showing large circular electron-dense structures (arrows). Note, the image is a composite of multiple images that are differentially contrasted to allow clear visualisation of cellular structures. A higher magnification of one region of interest (yellow box) is shown in the right panel. Scale bar 5 μm (inset 2 μm)

