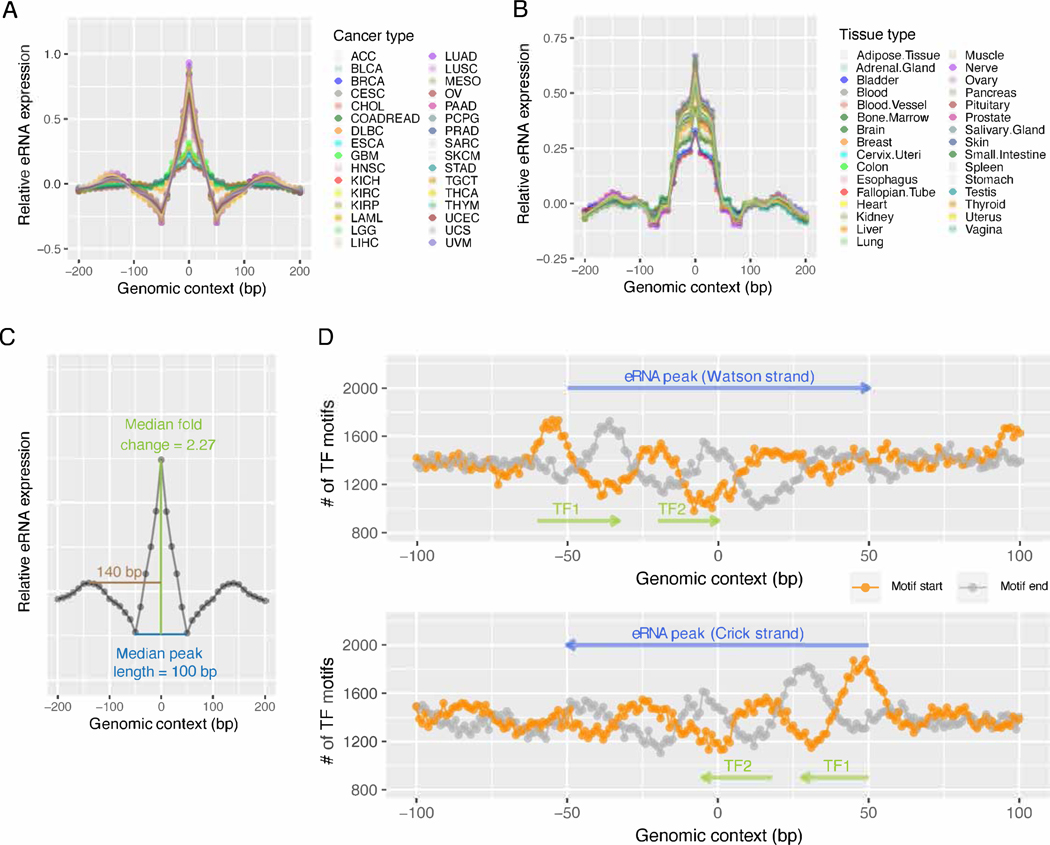
Figure 3. Characteristics of the super-enhancer eRNA expression peaks.
(A, B) The mean eRNA expression level on the flanking 200 bp sequences of 29,828 recurrent peaks identified in the 1,531 core super-enhancers in 32 TCGA cancer types (A) or 31 GTEx tissue types (B). For each cancer/tissue type, the 29,828 400 bp sequences were aligned with the peaks at the center (0 bp). Each point represents a 10 bp window. Mean RPKM was calculated for all 29,828 10 bp windows with the same relative positions to the peaks (indicated by the x-axis). The resulting mean RPKMs were normalized to Z-scores (indicated by the y-axis) for each cancer/tissue type. (C) The consensus profile of a typical eRNA expression peak in the TCGA dataset. The curve represents the median RPKM of the 29,828 peaks in 32 cancer types. (D) The density of the TF binding site (TFBS) motifs identified within the flanking 100 bp sequences of the 29,828 peaks. The 29,828 200 bp sequences were aligned with the peaks at the center (0 bp). Motifs on these DNA sequences were identified by the FIMO software with q <0.01. The y-value of the orange (or grey) curve represents the number of motif start/end sites identified at the same position relative to the peak (x-axis) on the DNA strand indicated by blue arrows. The phase difference, as indicated by the green arrows, between the orange and the grey curves, represents the enrichment of TFBS motifs at these locations. See also Figure S3.

