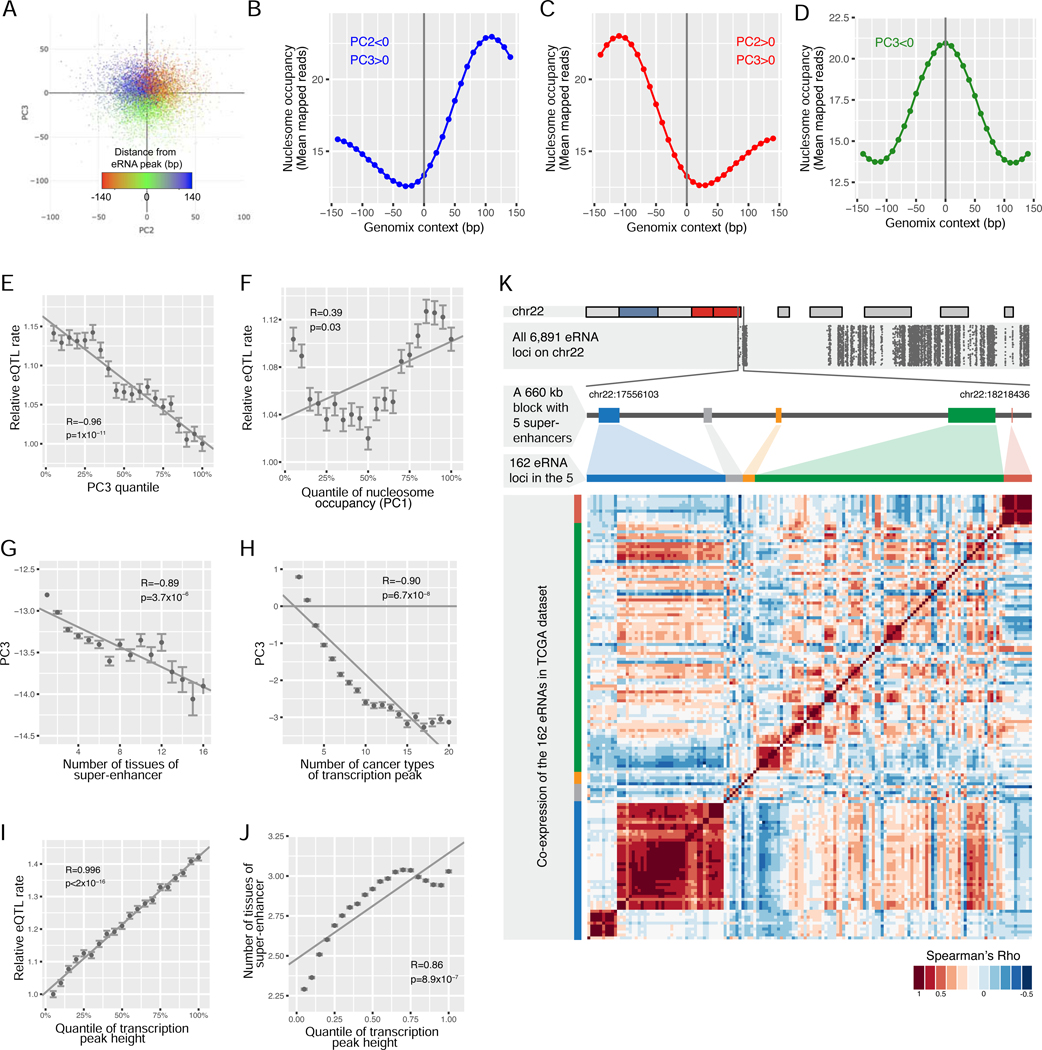
Figure 5. Identification of eRNA loci in the genome-wide super-enhancer regions.
(A) Principal component analysis (PCA) of nucleosome positioning on the flanking 140 bp sequences around ~4 million loci of local maximum eRNA RPKMs. The color represents the distance between the position with the maximum MNase-seq signal and the position of the local maximum eRNA RPKMs. Only the first 10,000 loci are plotted for convenient visualization. (B, C, and D) The sliding mean of mapped MNase-seq reads in all 27 nucleosome profiles in the flanking 140 bp DNA (each side) were plotted for loci meeting the indicated criterion: PC2<0/PC3>0 (B), PC2>0/PC3>0 (C), or PC3<0 (D). The sequences meeting the indicated criterion were aligned with the loci of the local maximum eRNA RPKMs at the center (0 bp). Each point represents a 10 bp window. The mean number of mapped MNase-seq reads was calculated for all 10 bp windows with the same relative positions to the peaks (indicated by the x-axis). (E, F) The correlation of the PC3 (E) or PC1 (F) quantile with the relative probability for a common SNP in its flanking 20 bp region to be identified as a GTEx eQTL. For loci with indicated PC3/PC1 quantile, this probability was calculated by dividing the number of GTEx eQTLs in the region with the total number of common SNPs (minor allele frequency >20% in 1000 Genome Project) in the region. The resulting probabilities were normalized by dividing them with the minimum value of all quantiles (y-axis). (G, H) The correlation of the PC3 quantile with the frequency for the loci to be identified as a super-enhancer in the original 86 tissue/cell types (G) or with the recurrence frequency as local maximum RPKM in 32 TCGA cancer types (H). (I) The correlation of the relative height of a locus with the relative probability for a common SNP in its flanking 20 bp to be identified as a GTEx eQTL. (J) The correlation of the relative height of a locus with the frequency for the loci to be identified as a super-enhancer in the original 86 tissue/cell types. (K) The distribution of eRNA peaks in super-enhancer regions on chr22 (top panel), with each dot representing one of the ~7,000 peaks on the chromosome (the second panel). A ~660 kb block containing the first five super-enhancers is zoomed in on the third panel. The order of the 162 eRNAs in these regions (fourth panel) and a heatmap representing the pairwise correlation (Spearman’ Rho) among the 162 super-enhancer eRNA peaks in the region across 66 TCGA cancer subtypes (bottom panel). See also Figure S5, S6, and Table S3.

