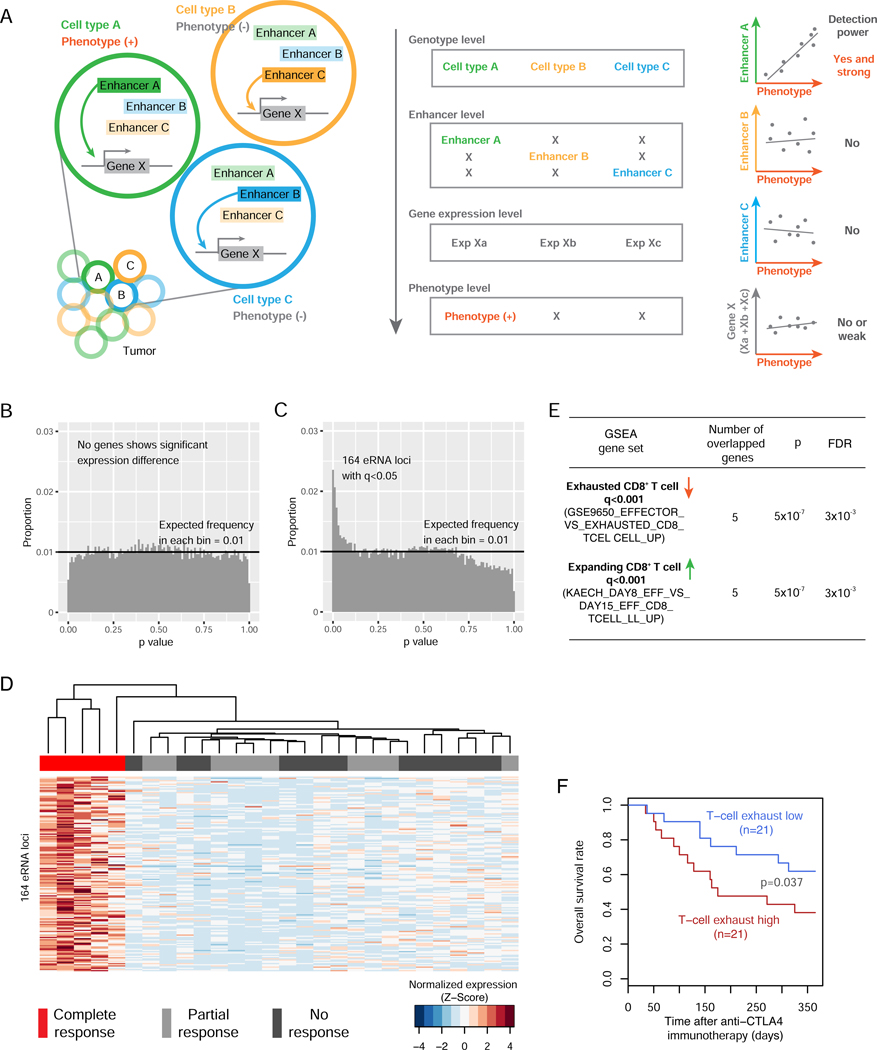
Figure 6. The eRNA loci in super-enhancers provide additional explanatory power for immunotherapeutic response by resolving tumor heterogeneity.
(A) A cartoon model illustrating how cell-type-specific enhancers can increase the explanatory power of quantitative traits by resolving tumor heterogeneity. Left: a hypothetical bulk tumor consists of three different cell types in which enhancer A, B, or C controls the expression of gene X, respectively; and only cell type C contributes to a phenotype of interest. Right: distinct correlation patterns when correlating different eRNA or mRNA signals with the phenotype. (B) The p-value distribution of coding genes through the differential analysis in a cohort of 28 melanomas with different responses to anti-PD1 immunotherapy (q <0.1). (C) The p-value distribution of eRNAs through the differential analysis in the same cohort as in B (q <0.05; ANOVA test). (D) Unsupervised clustering based on the RPKM values of the 164 eRNA loci across the 28 tumors. The RPKMs were normalized by each eRNA peak (row) in the 28 tumors. (E) GSEA results of the 36 genes targeted by at least one GTEx eQTL in the 164 eRNA locus regions (defined as the flanking 50 bp DNA on either side of the eRNA loci). (F) The combined expression level (sum of log2RPKM) of the 8 non-redundant genes in E exhibits prognostic power in a cohort of 42 patients receiving anti-CTLA-4 immunotherapy (p = 0.037; one-sided HF-test). See also Figure S7 and Table S4.

