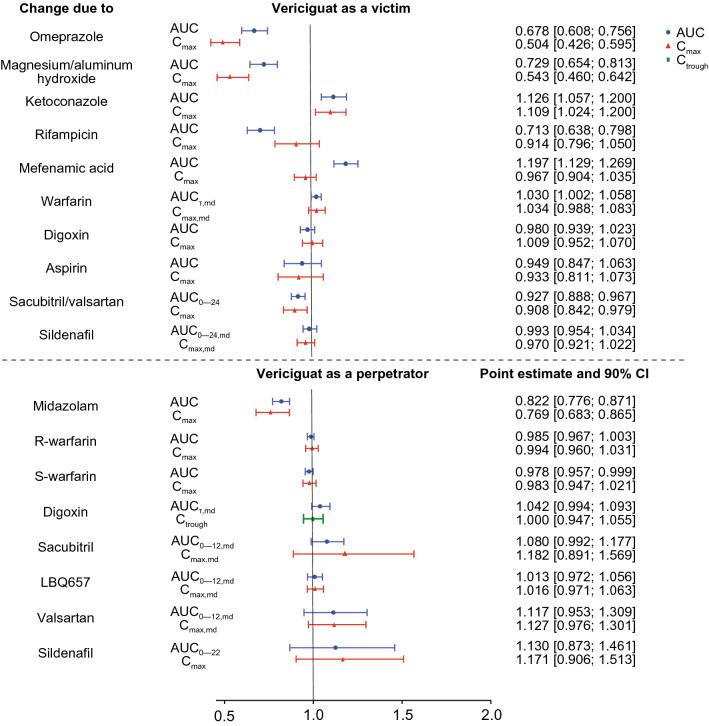
Fig. 2.
Summary of clinical interactions and pharmacokinetic changes investigating the perpetrator and victim potential of vericiguat. AUC area under the concentration–time curve, AUC0–12,md AUC from time 0 to 12 h after multiple dose administration, AUC(0–22) AUC from time 0 to 22 h, AUC(0–24) AUC from time 0 to 24 h, AUC(0–24),md AUC0–24 after multiple-dose administration, AUCτ,md AUC within the dosing interval after multiple dosing, CI confidence interval, Cmax maximum concentration within a dosing interval, Cmax,md Cmax within a dosing interval after multiple dose administration, Ctrough trough concentration within a dosing interval

