Fig. 1.
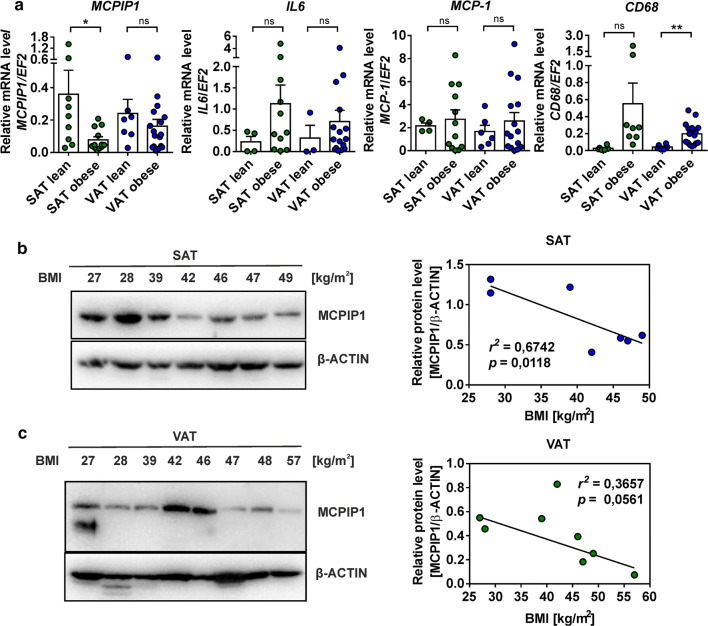
MCPIP1 levels in human adipose tissue of lean and obese subjects. a Scatter dot plot graph (mean ± SEM) showing expression analysis of MCPIP1, IL-6, MCP-1 and CD68 mRNA in SAT and VAT adipose tissues of lean (BMI < 28; MCPIP1: n = 9 for SAT and n = 7 for VAT; IL6: n = 4 for SAT and n = 3 for VAT; MCP-1: n = 4 for SAT and n = 6 for VAT; CD68: n = 6 for SAT and n = 6 for VAT) and obese (BMI > 30; MCPIP1: n = 12 for SAT and n = 17 for VAT; IL6: n = 11 for SAT and n = 16 for VAT; MCP-1: n = 12 for SAT and n = 15 for VAT; CD68: n = 8 for SAT and n = 16 for VAT) subjects estimated by Q-RT-PCR. Transcript levels were normalized to EF2 mRNA levels. P values were estimated using two-tailed unpaired Student t test. b Left panel: Western blot analysis of MCPIP1 protein levels in subjects with different range of BMI in SAT (BMI: 27–49; n = 7) and c VAT (BMI: 27–57; n = 8). MCPIP1 protein levels were normalized to β-actin as the loading control. b, c Right panel presents the quantification of correlation between the MCPIP1 protein level and BMI in SAT and VAT. Statistical significance was determined with Pearson’s correlation. *p < 0.05; **p < 0.01

