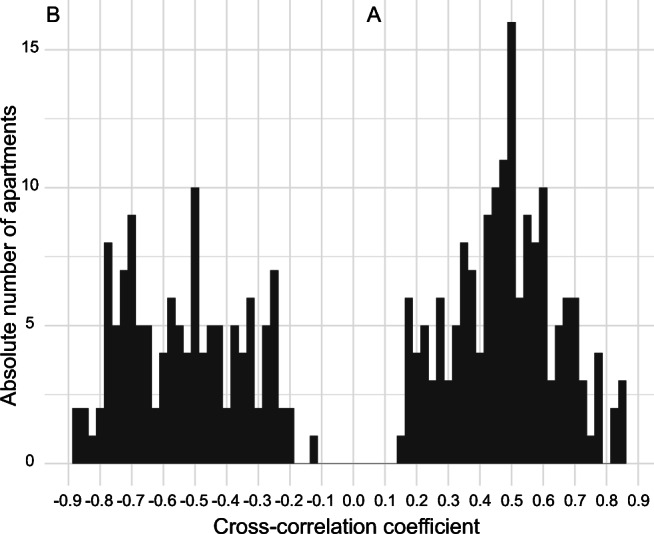
Fig. 1.

Absolute number of apartments by apartment-specific cross-correlation coefficients. The two peaks illustrate two opposite apartment types, over-controlled on the left with negative correlations, and under-controlled on the right with positive correlations between outdoor and indoor temperatures. Controlled apartments have not been omitted from the histogram, which displays the cross-correlation coefficients of all apartments in the study
