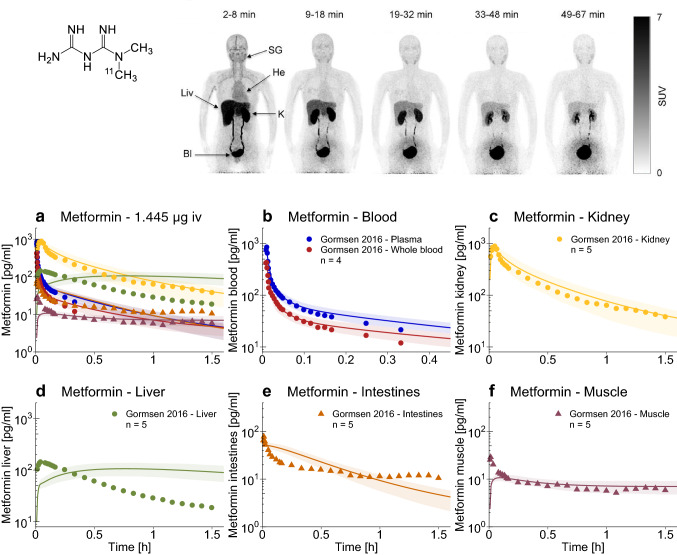
Fig. 3.
Metformin tissue concentrations. Upper panel: pseudodynamic whole-body positron emission tomography imaging of a representative patient following an intravenous microdose of 11C-metformin [7]
© SNMMI. a–f Population predictions of metformin blood and tissue concentration–time profiles measured in the 11C-metformin positron emission tomography study, compared to observed data [7]. Population prediction arithmetic means are shown as lines; the shaded areas illustrate the 68% population prediction intervals. Observed data are shown as dots (training dataset) or triangles (test dataset). Linear plots are presented in the ESM. Bl bladder, He heart, iv intravenous, K kidney, Liv liver, SG submandibular gland, SUV standardized uptake value = concentration [kBq/mL]·body weight [g]/injected dose [kBq]

