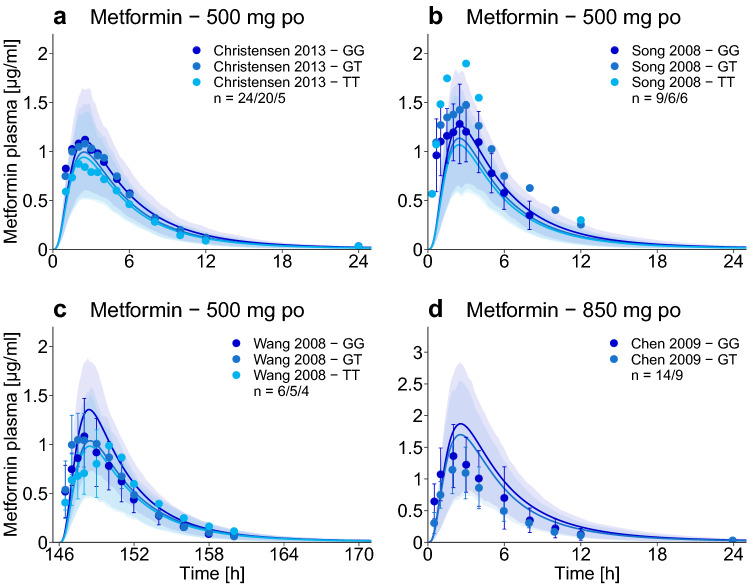
Fig. 4.
Impact of organic cation transporter 2 (OCT2) polymorphism. Population predictions of metformin plasma concentration–time profiles in different SLC22A2 genotypes, compared to observed data [17, 18, 21, 29]. Population prediction arithmetic means are shown as dark blue (SLC22A2 808GG, reference genotype) or lighter blue (SLC22A2 808GT and 808TT, variant genotypes) lines. The shaded areas illustrate the respective 68% population prediction intervals. Observed data are shown as dots ± standard deviation. Details on the study protocols, semilogarithmic plots, and quantitative model performance measures are provided in the ESM. GG SLC22A2 808GG genotype, GT SLC22A2 808GT genotype, po oral, TT SLC22A2 808TT genotype

