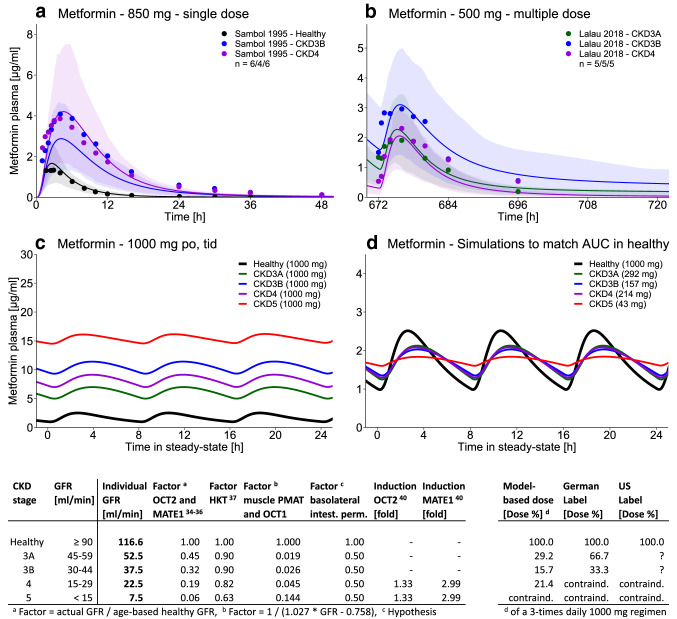
Fig. 6.
Impact of renal impairment and model-based chronic kidney disease (CKD) dose recommendations. a, b Population predictions of metformin plasma concentration–time profiles in different stages of CKD, compared to observed data [12, 39]. Population prediction arithmetic means are shown as black (healthy) or colored (CKD3A-4) lines. The shaded areas illustrate the respective 68% population prediction intervals. Observed data are shown as dots in corresponding colors. c Simulations of metformin exposure in CKD3A-5 patients compared to healthy individuals using an oral (po) dose of 1000 mg, three times daily (tid). d Simulations of metformin exposure in CKD3A-5 patients to match the steady-state area under the curve (AUC) of 1000 mg po, tid in healthy individuals. The tables show the implementation of renal impairment (on the left) and the model-based dose recommendations compared to the guidance in the US and German labels (on the right). contraind. contraindicated, GFR glomerular filtration rate, HKT hematocrit, intest. perm. intestinal permeability, MATE multidrug and toxin extrusion protein, OCT organic cation transporter, PMAT plasma membrane monoamine transporter

