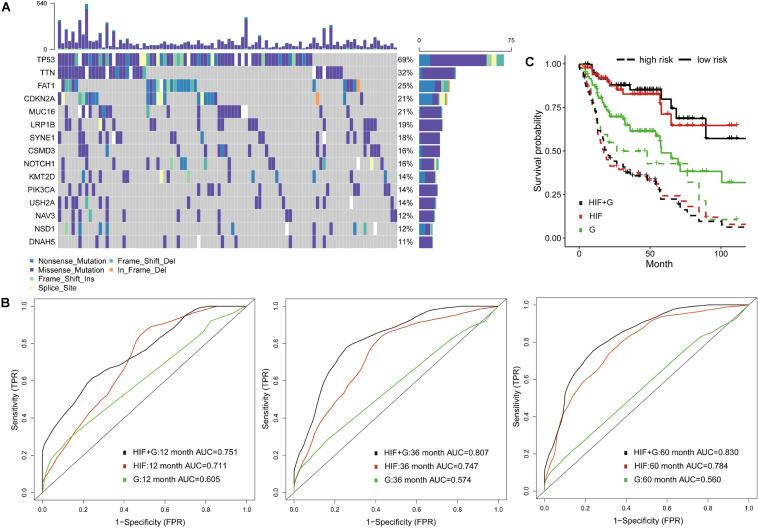
FIGURE 3.
Prognostic model integrating histopathological image features with genomics. (A) The waterfall plot of 15 common somatic mutant genes in training set. (B) The 1-, 3-, and 5-year area under the time-dependent receiver operating characteristic curve (AUC), and (C) Kaplan-Meier survival curves showed improved predictive performance of integrative histopathology + genomics model (HIF + G) than histopathological image features alone (HIF) or genomics alone (G) in validation set.

