Figure 2.

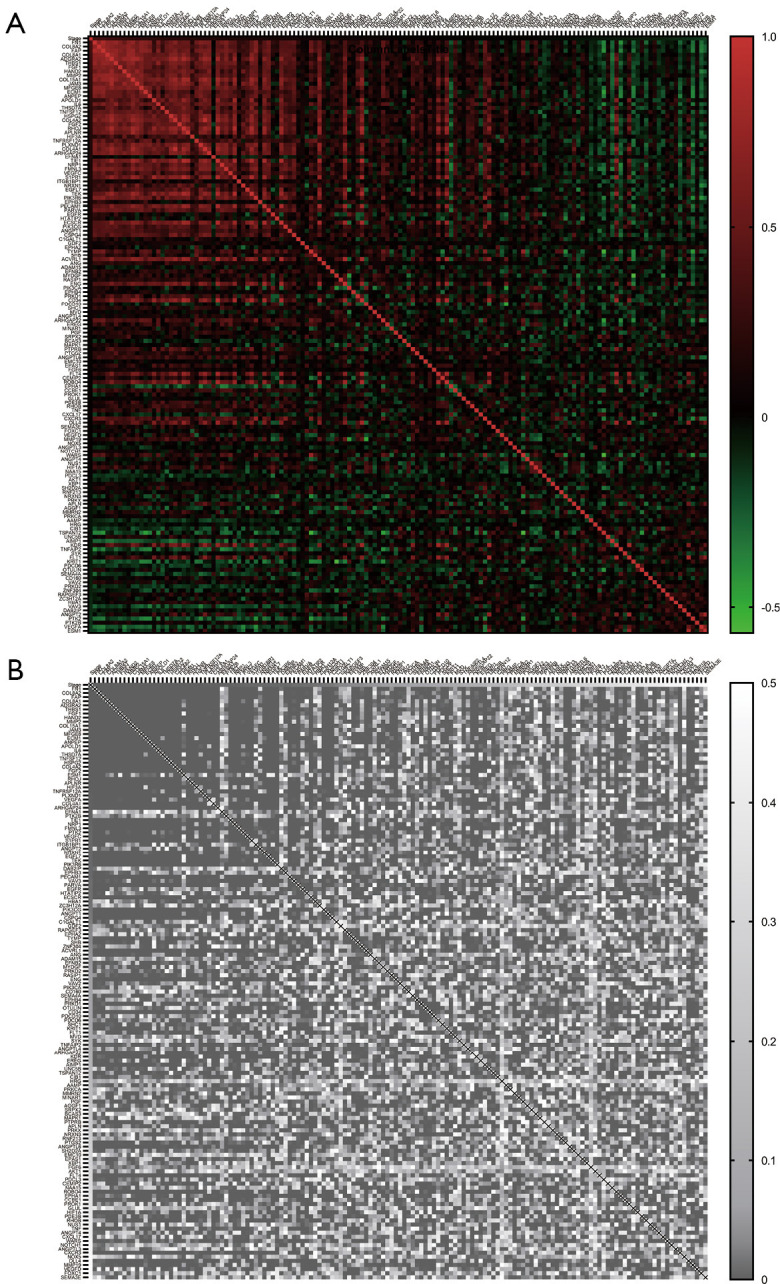
Regression analysis revealed the genes expression correlated with stage progression. (A) the Pearson correlation value (r) of stage and genes; (B) the statistical significance (P value) of corresponding correlation values.

Regression analysis revealed the genes expression correlated with stage progression. (A) the Pearson correlation value (r) of stage and genes; (B) the statistical significance (P value) of corresponding correlation values.