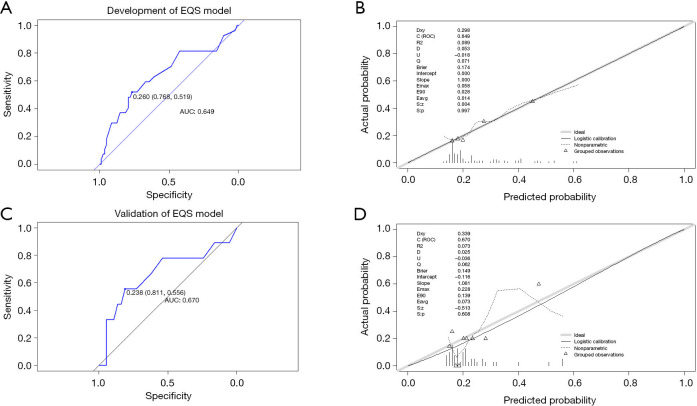
Figure 5.
Receiver operating characteristic (ROC) curves and calibration curves of the three prediction models using the training cohort and the validation cohort. The ROC curves of development (A) and validation (C) of the EQS model. The calibration curves of development (B) and validation (D) of the EQS model. AUC, the area under the ROC curve.

